
Grafana for Captivating Digital Signage
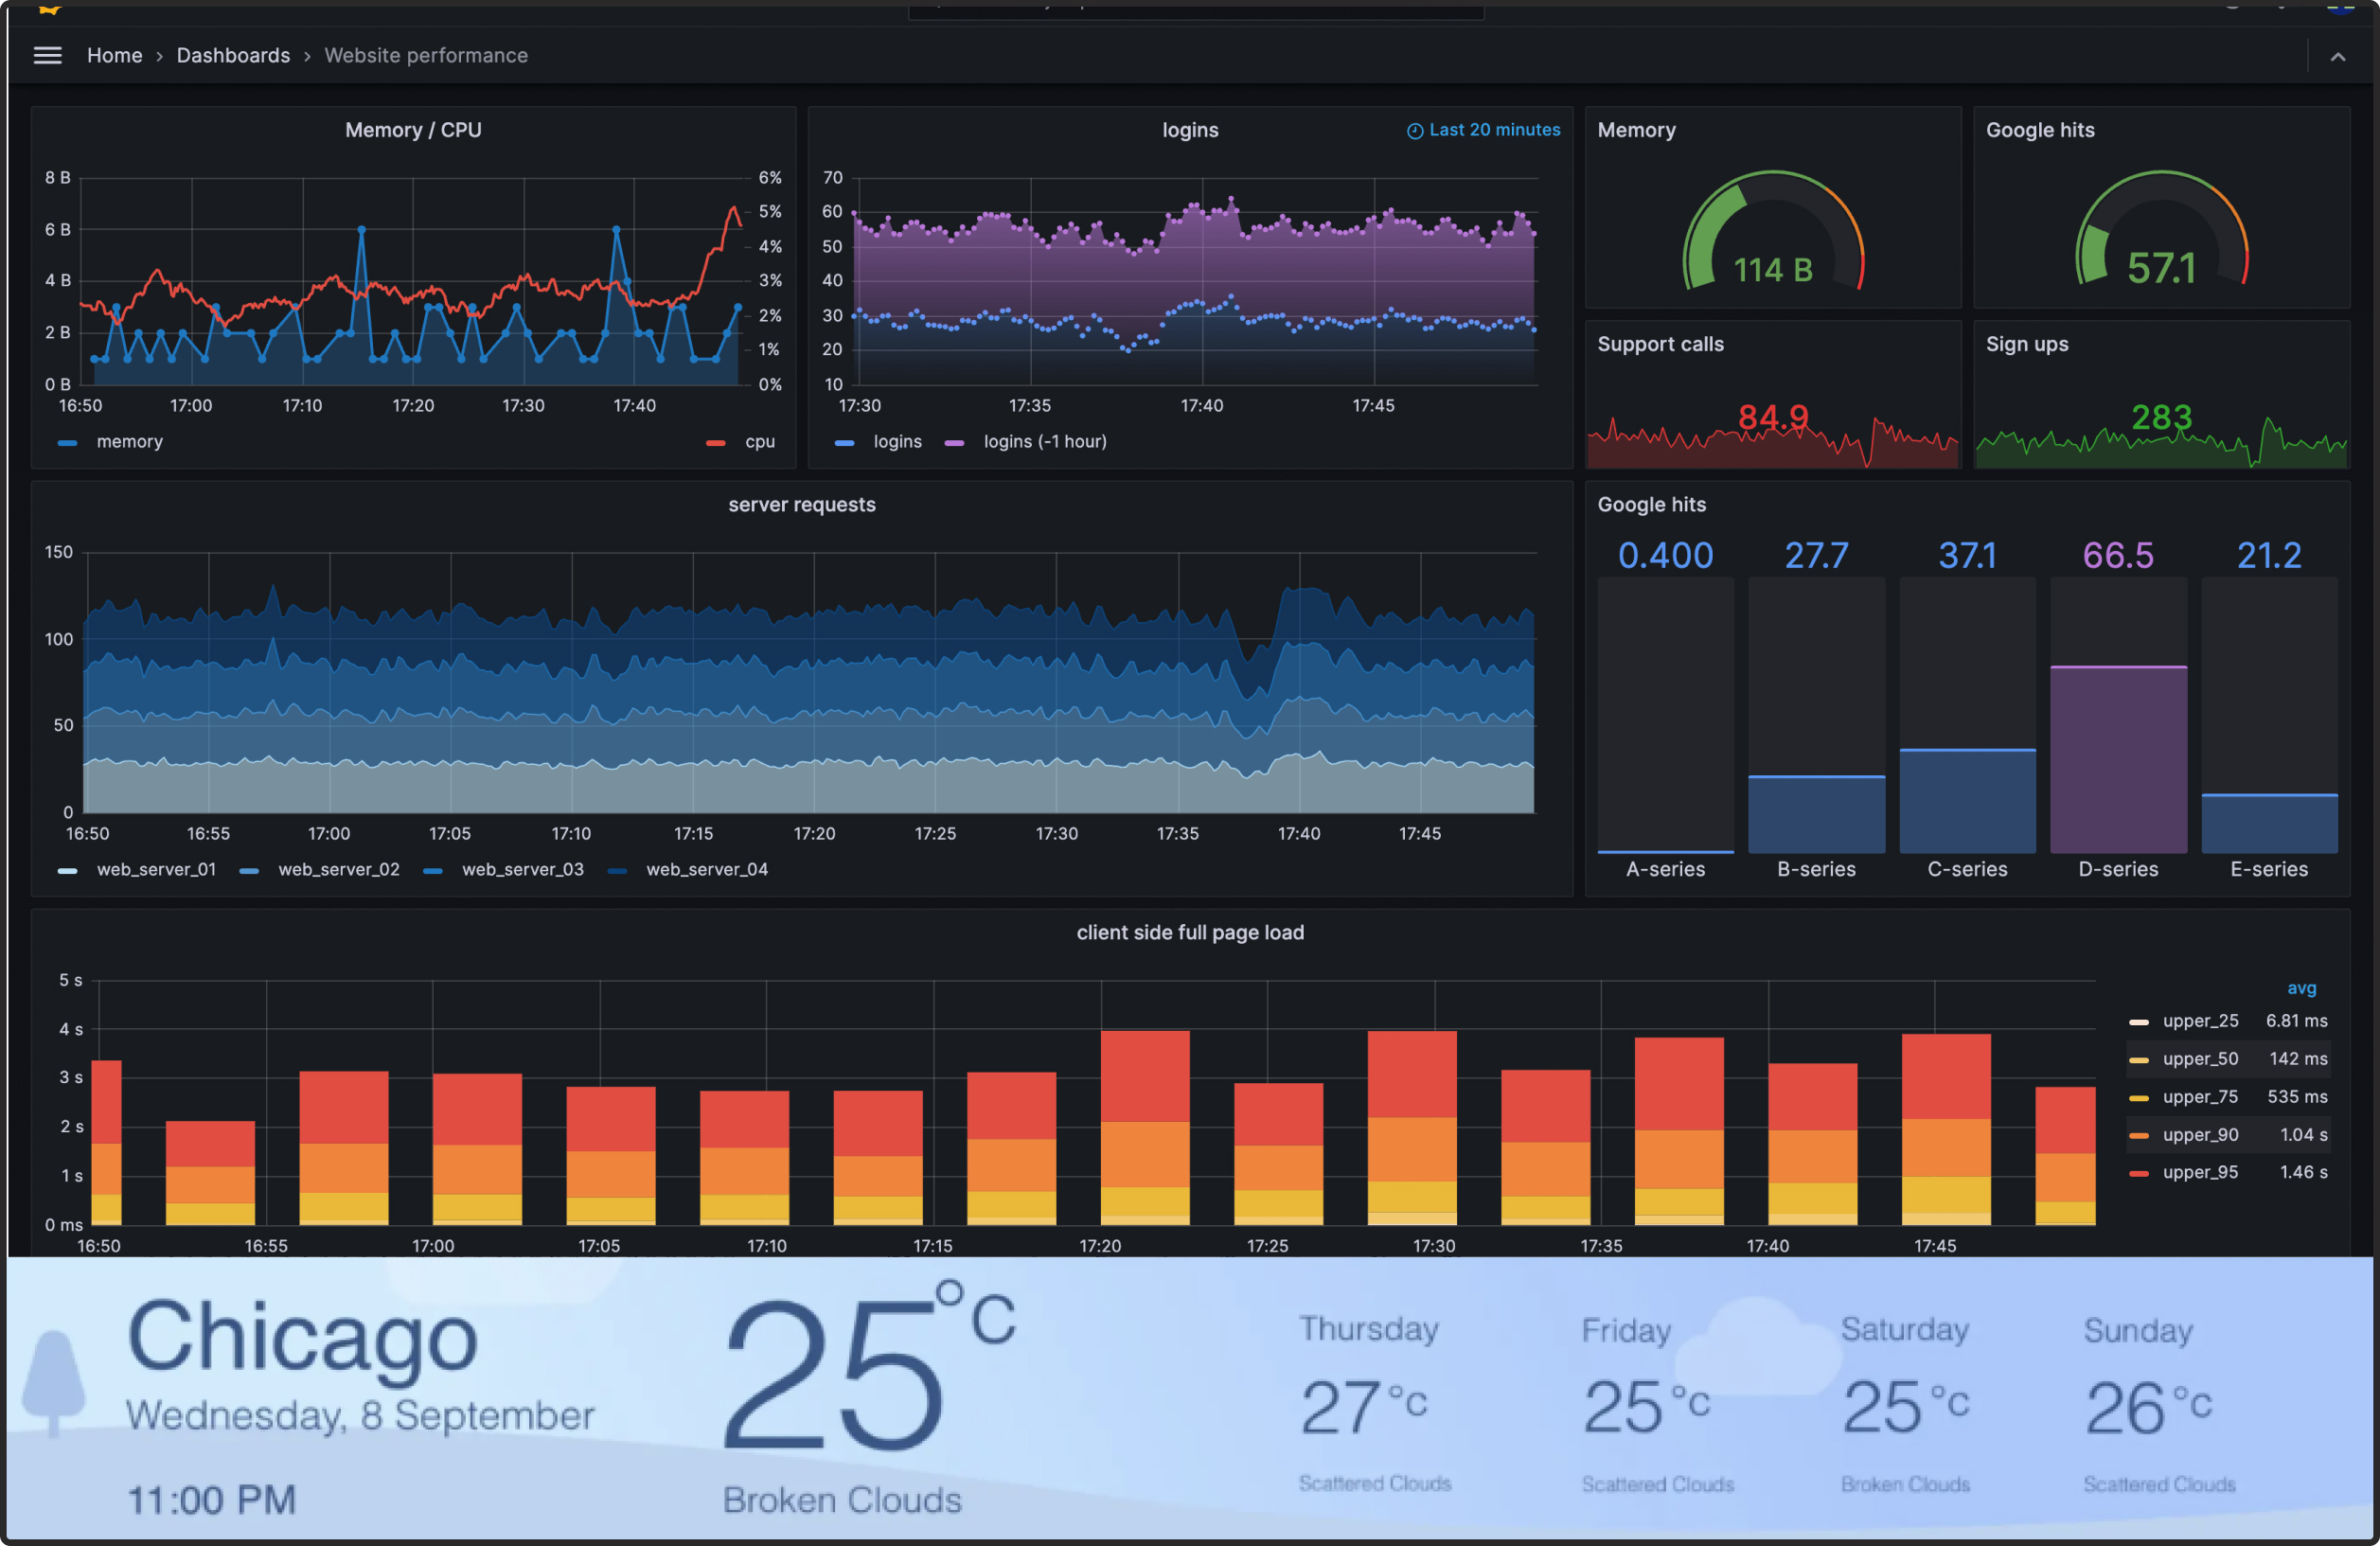
Engage your audience with dynamic visualizations. Pickcel integrates seamlessly with Grafana, allowing you to showcase your most impactful dashboards and leverage live data streams directly on your digital signs.
Key Features
Live Grafana feeds
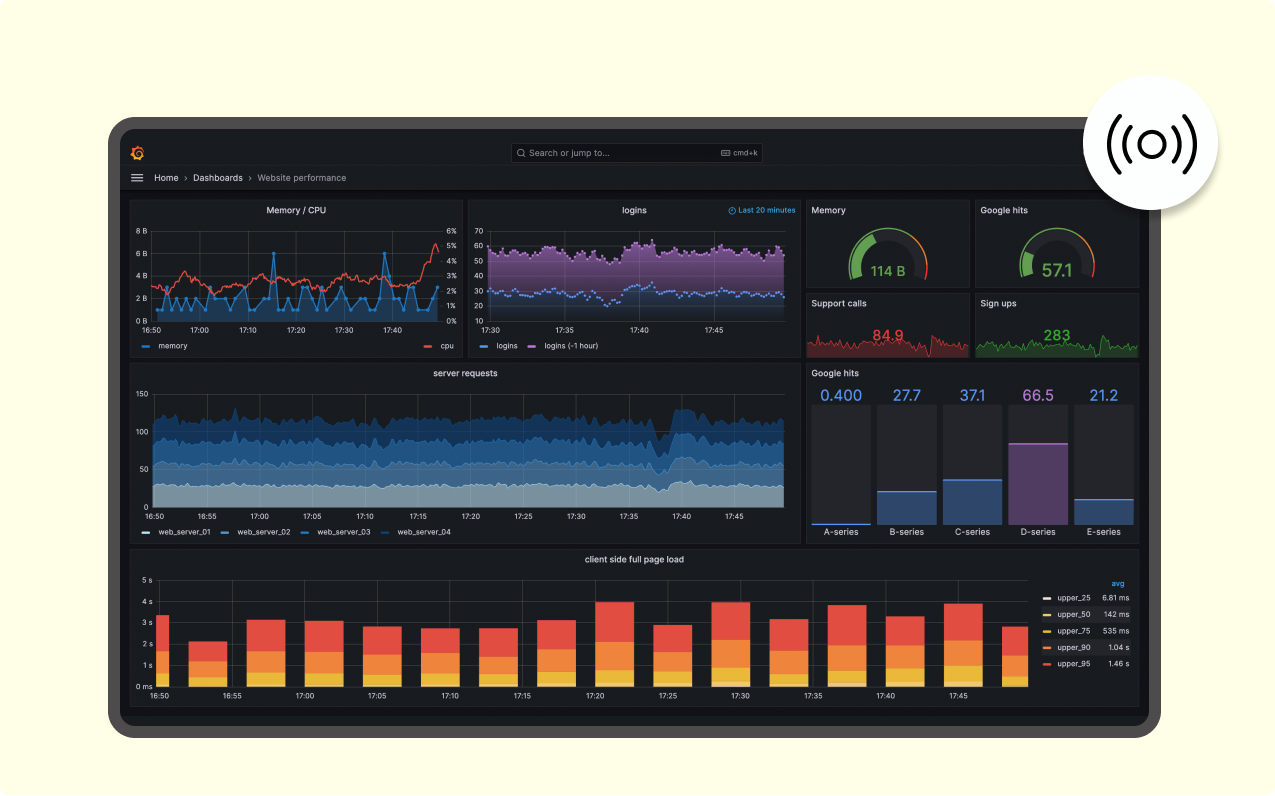
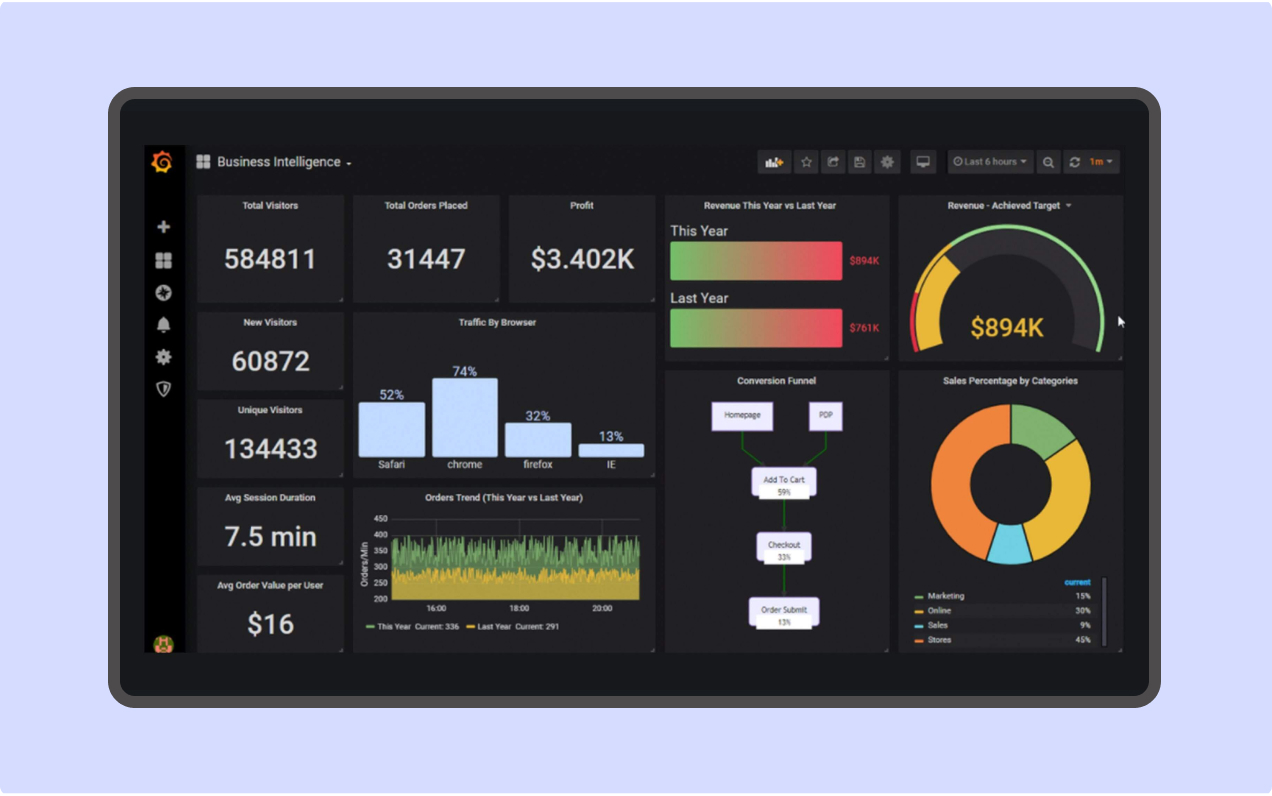
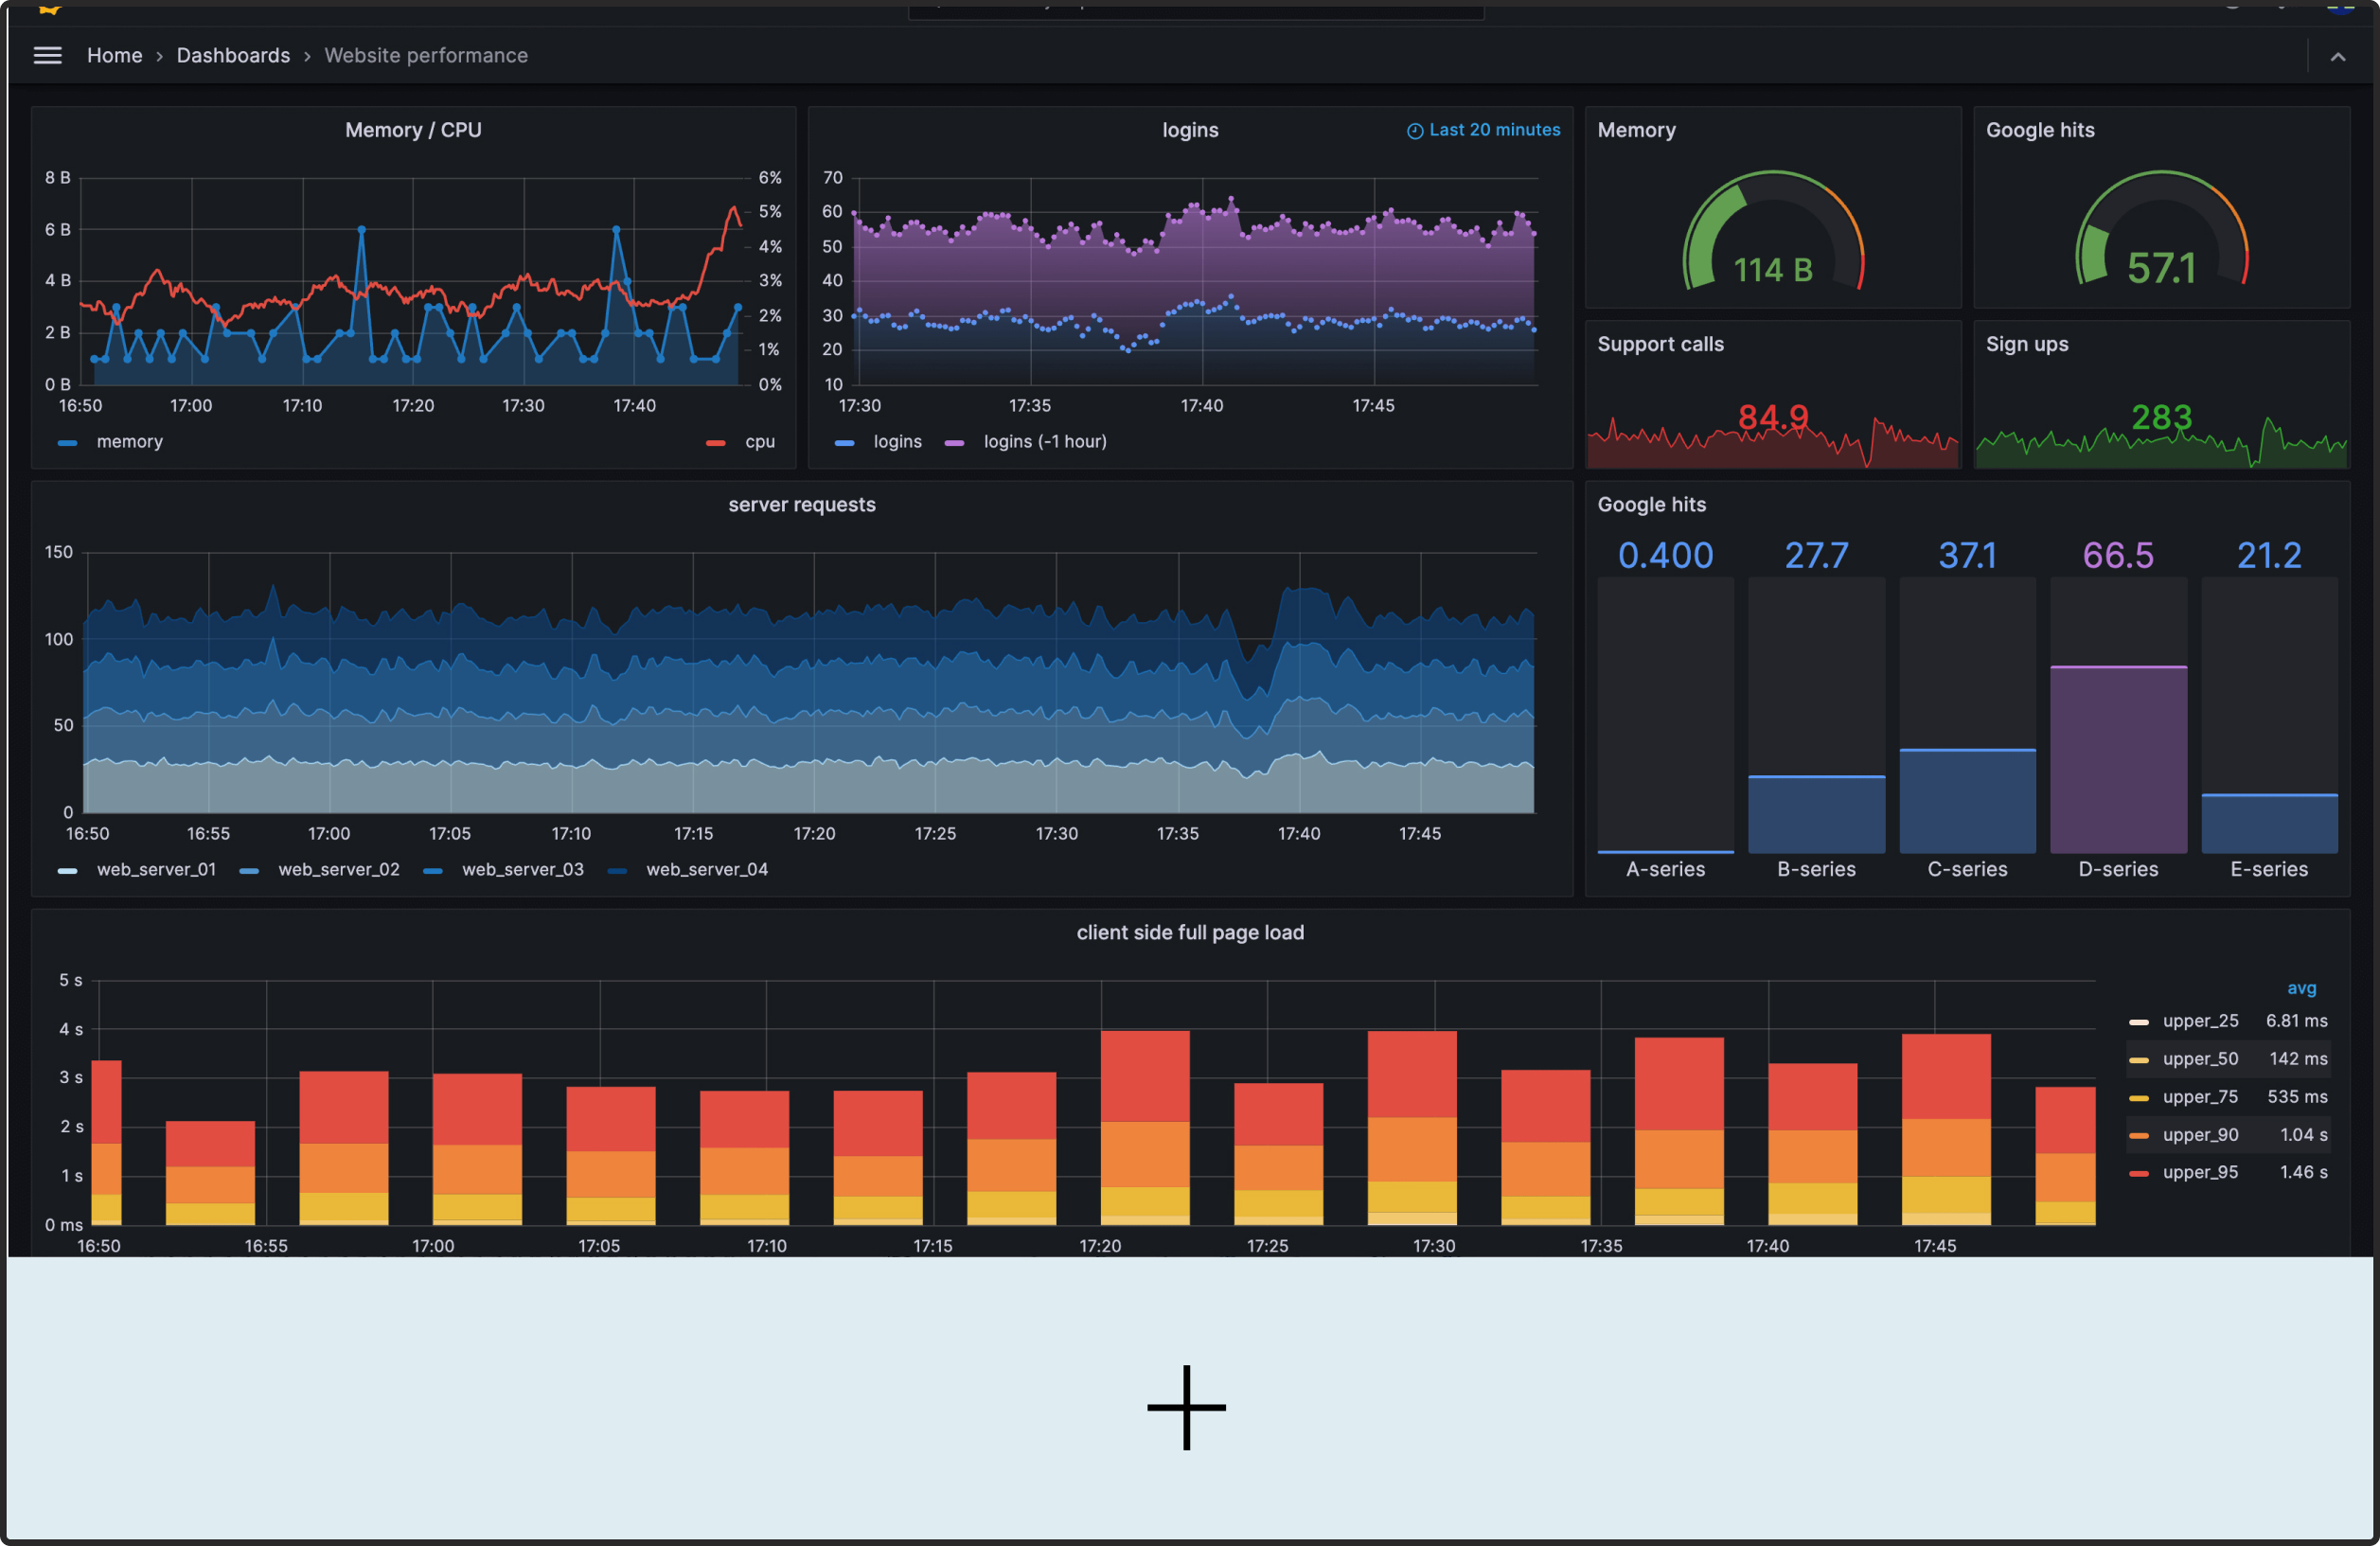
Breathe life into your Grafana dashboards. Display real-time data for continuous insights and audience engagement.
Interactive exploration
Empower viewers to delve deeper. Pickcel preserves Grafana's interactivity, allowing users to explore specific data points directly on your digital signs.
Customizable alerts
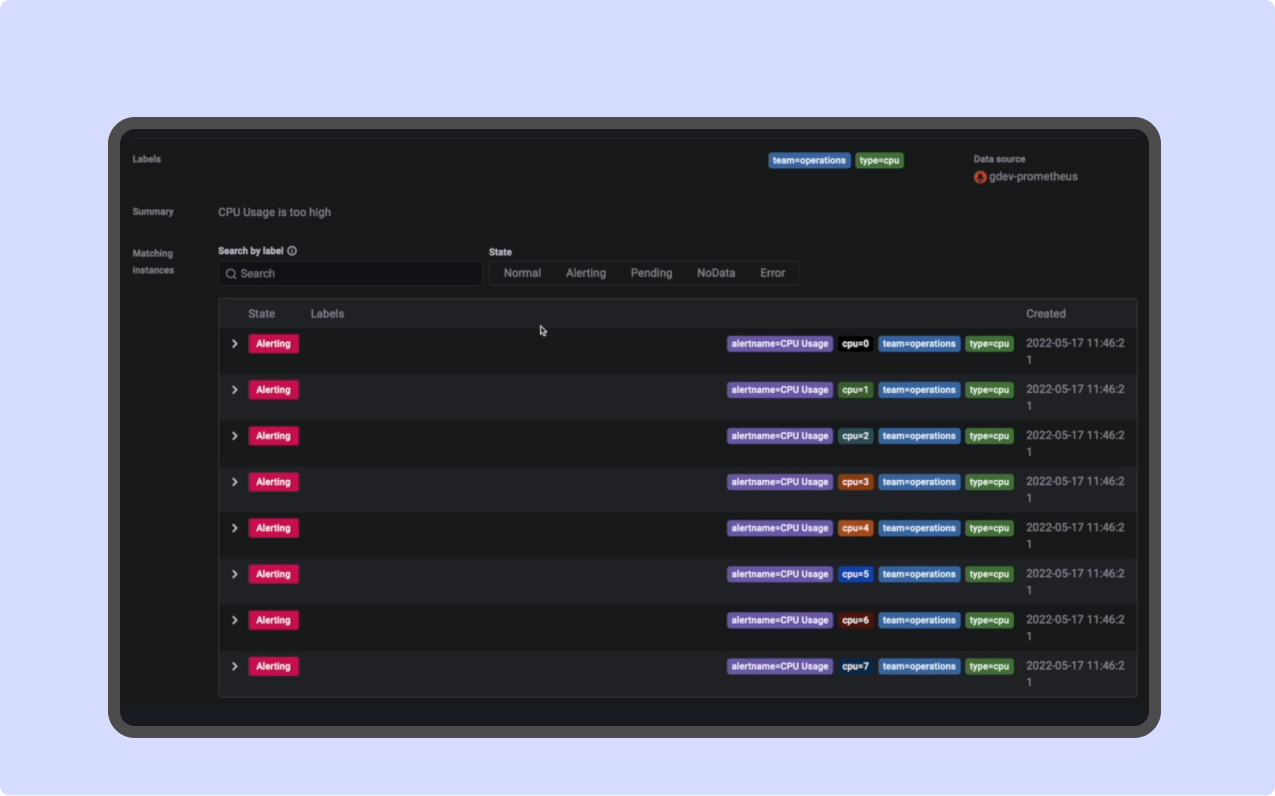
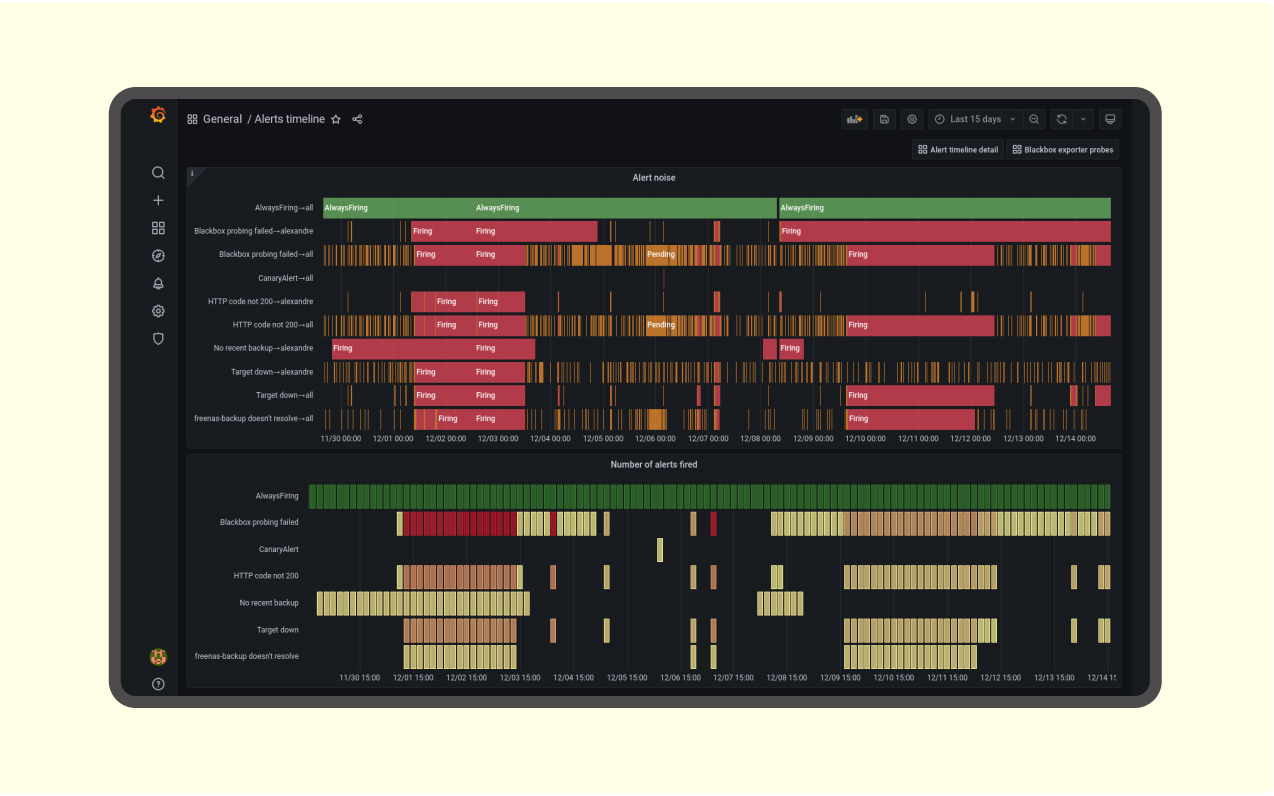
Get notified instantly. Pickcel integrates with Grafana's alerting system, enabling immediate visual notifications of critical events on your digital signage.
Granular row-level security
Pickcel integrates seamlessly with Grafana's row-level security controls, ensuring only authorized users see specific data points within your visualizations displayed on digital signage.
More benefits of Pickcel with Grafana

Customizable timeframes
Explore data for specific timeframes directly on digital signage. Pickcel integrates with Grafana's time picker functionality, empowering your audience to analyze historical trends or focus on recent activity.

Data annotations
Overlay live data streams with annotations and text directly on your digital signage to highlight critical trends, equipment status changes, or provide contextual information alongside your Grafana visualizations.
Use cases across diverse industries
We have listed a few. The sky is the limit for

IT operations
Display real-time resource utilization metrics (CPU, memory, storage) for servers and infrastructure on digital signage.
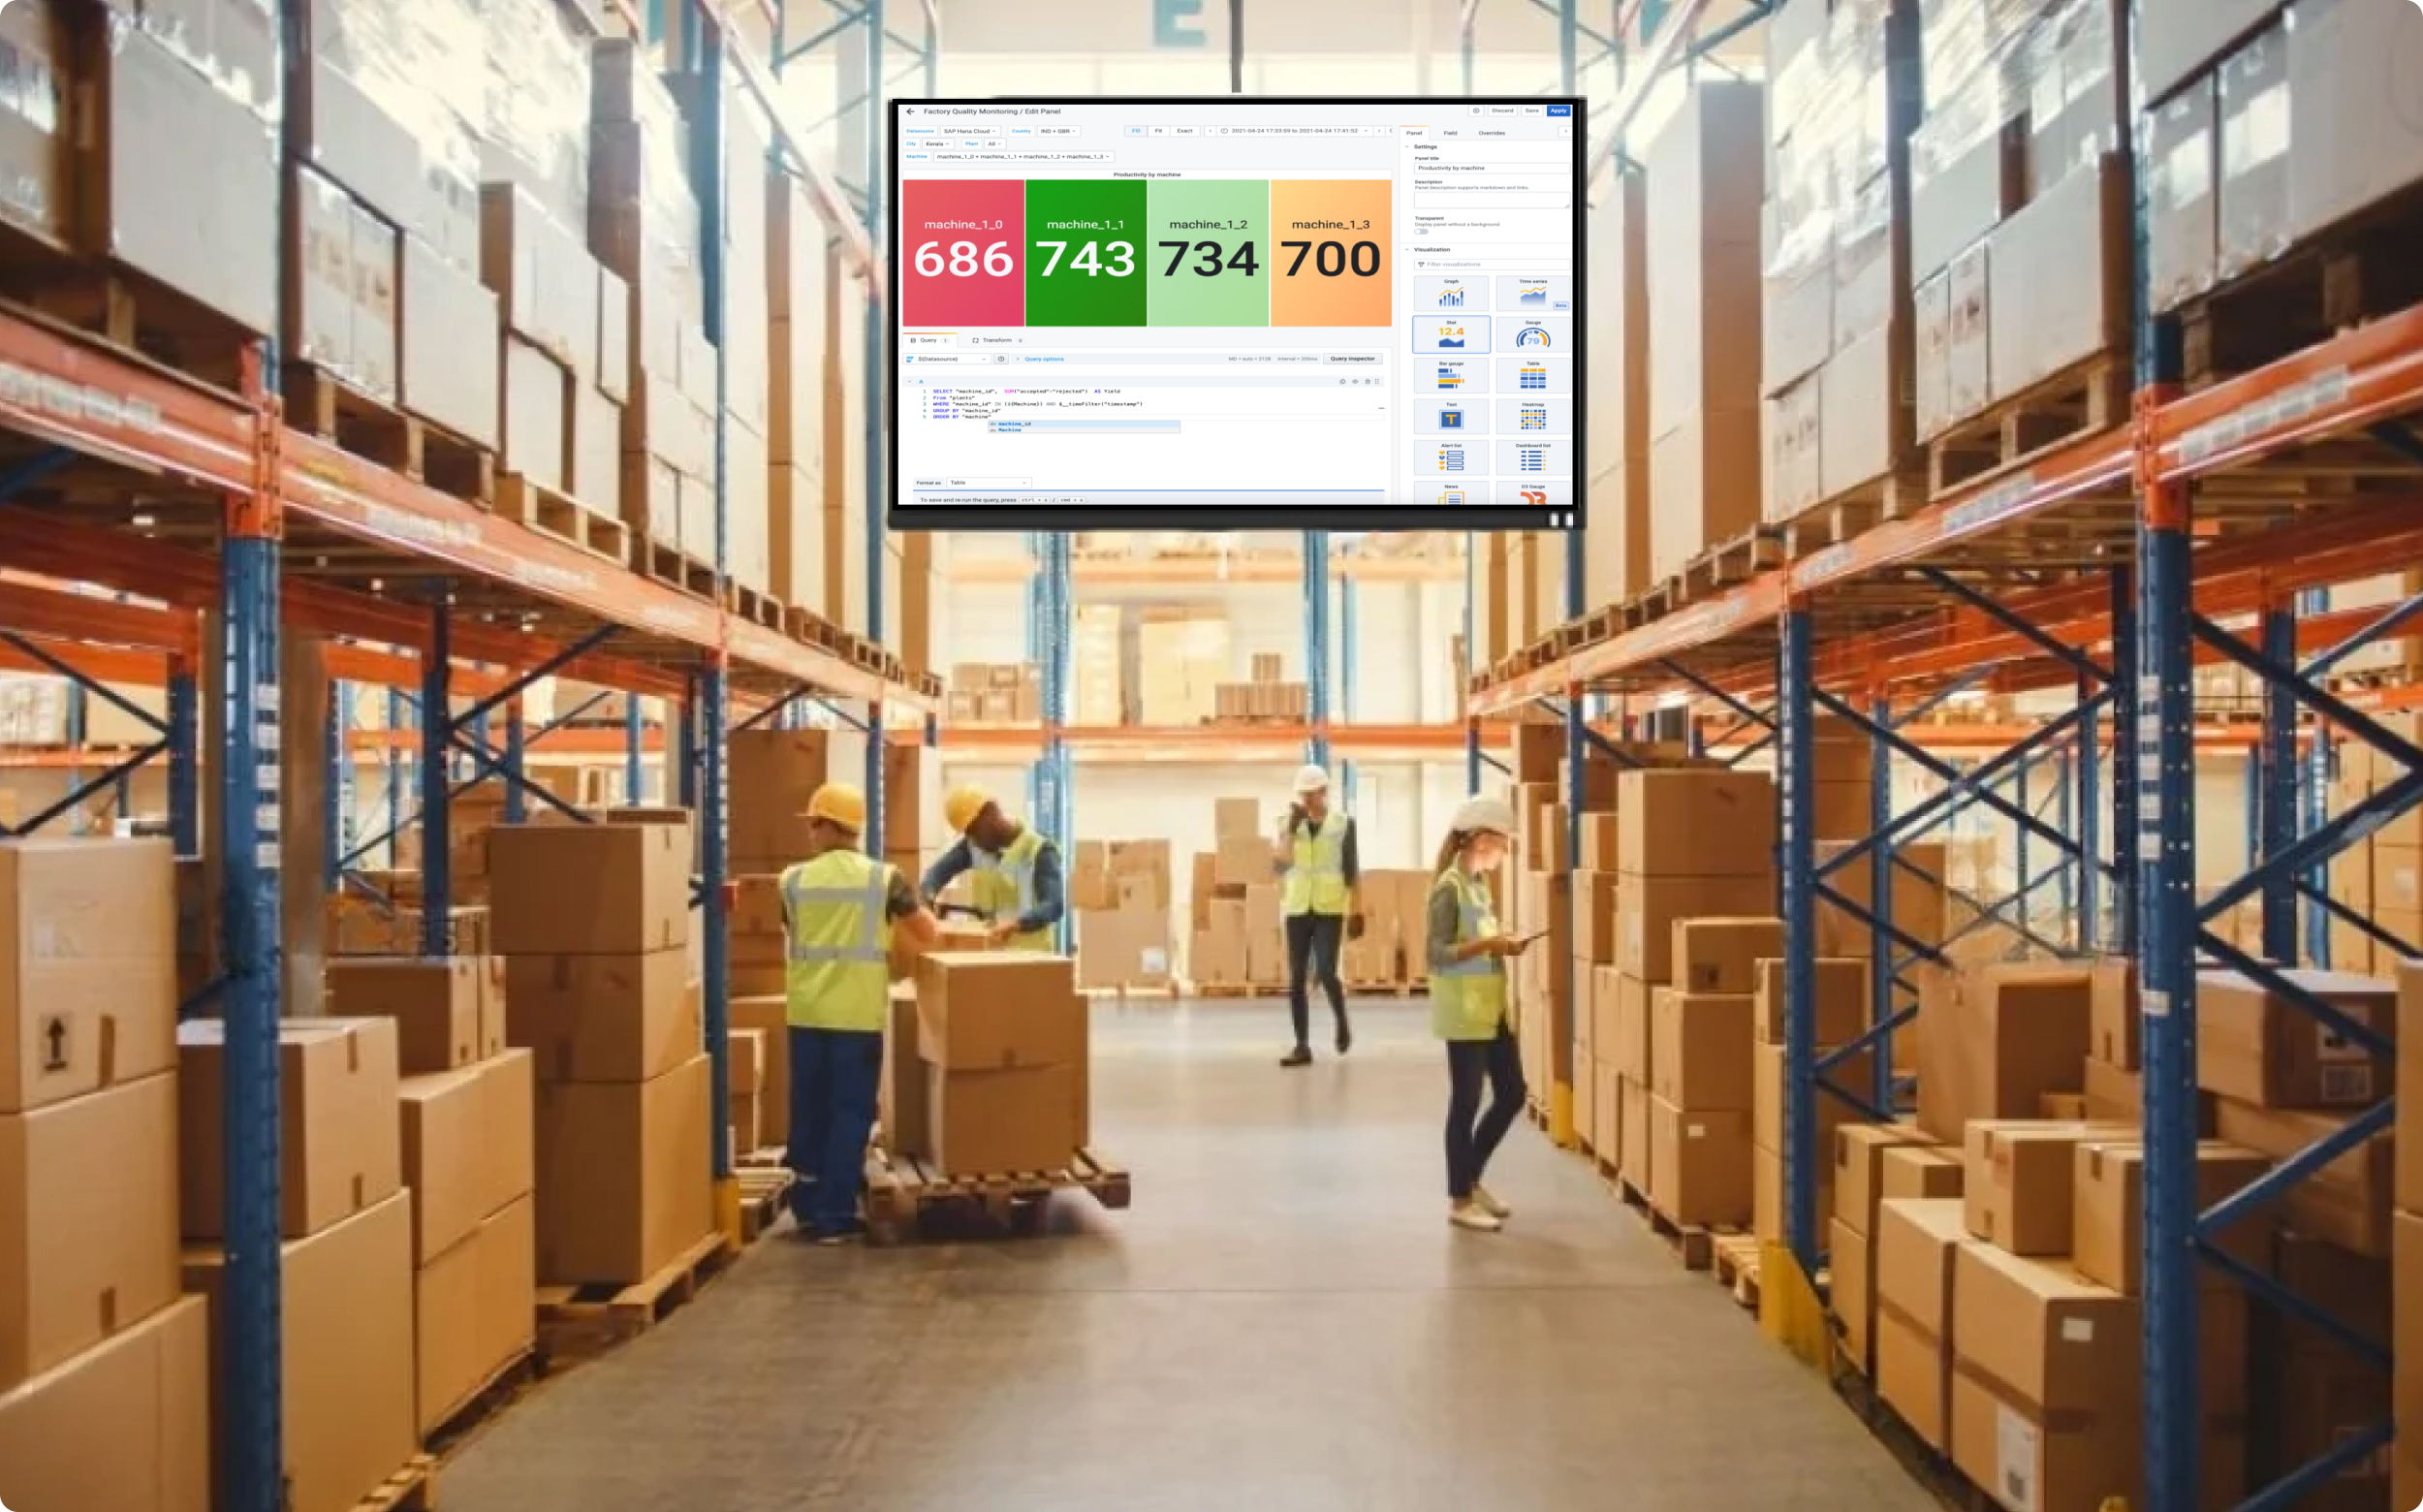
Manufacturing & production
Display live environmental monitoring data (e.g., temperature, humidity) on digital signage to ensure optimal production conditions and worker safety..
How to integrate grafana with our Digital Signage?
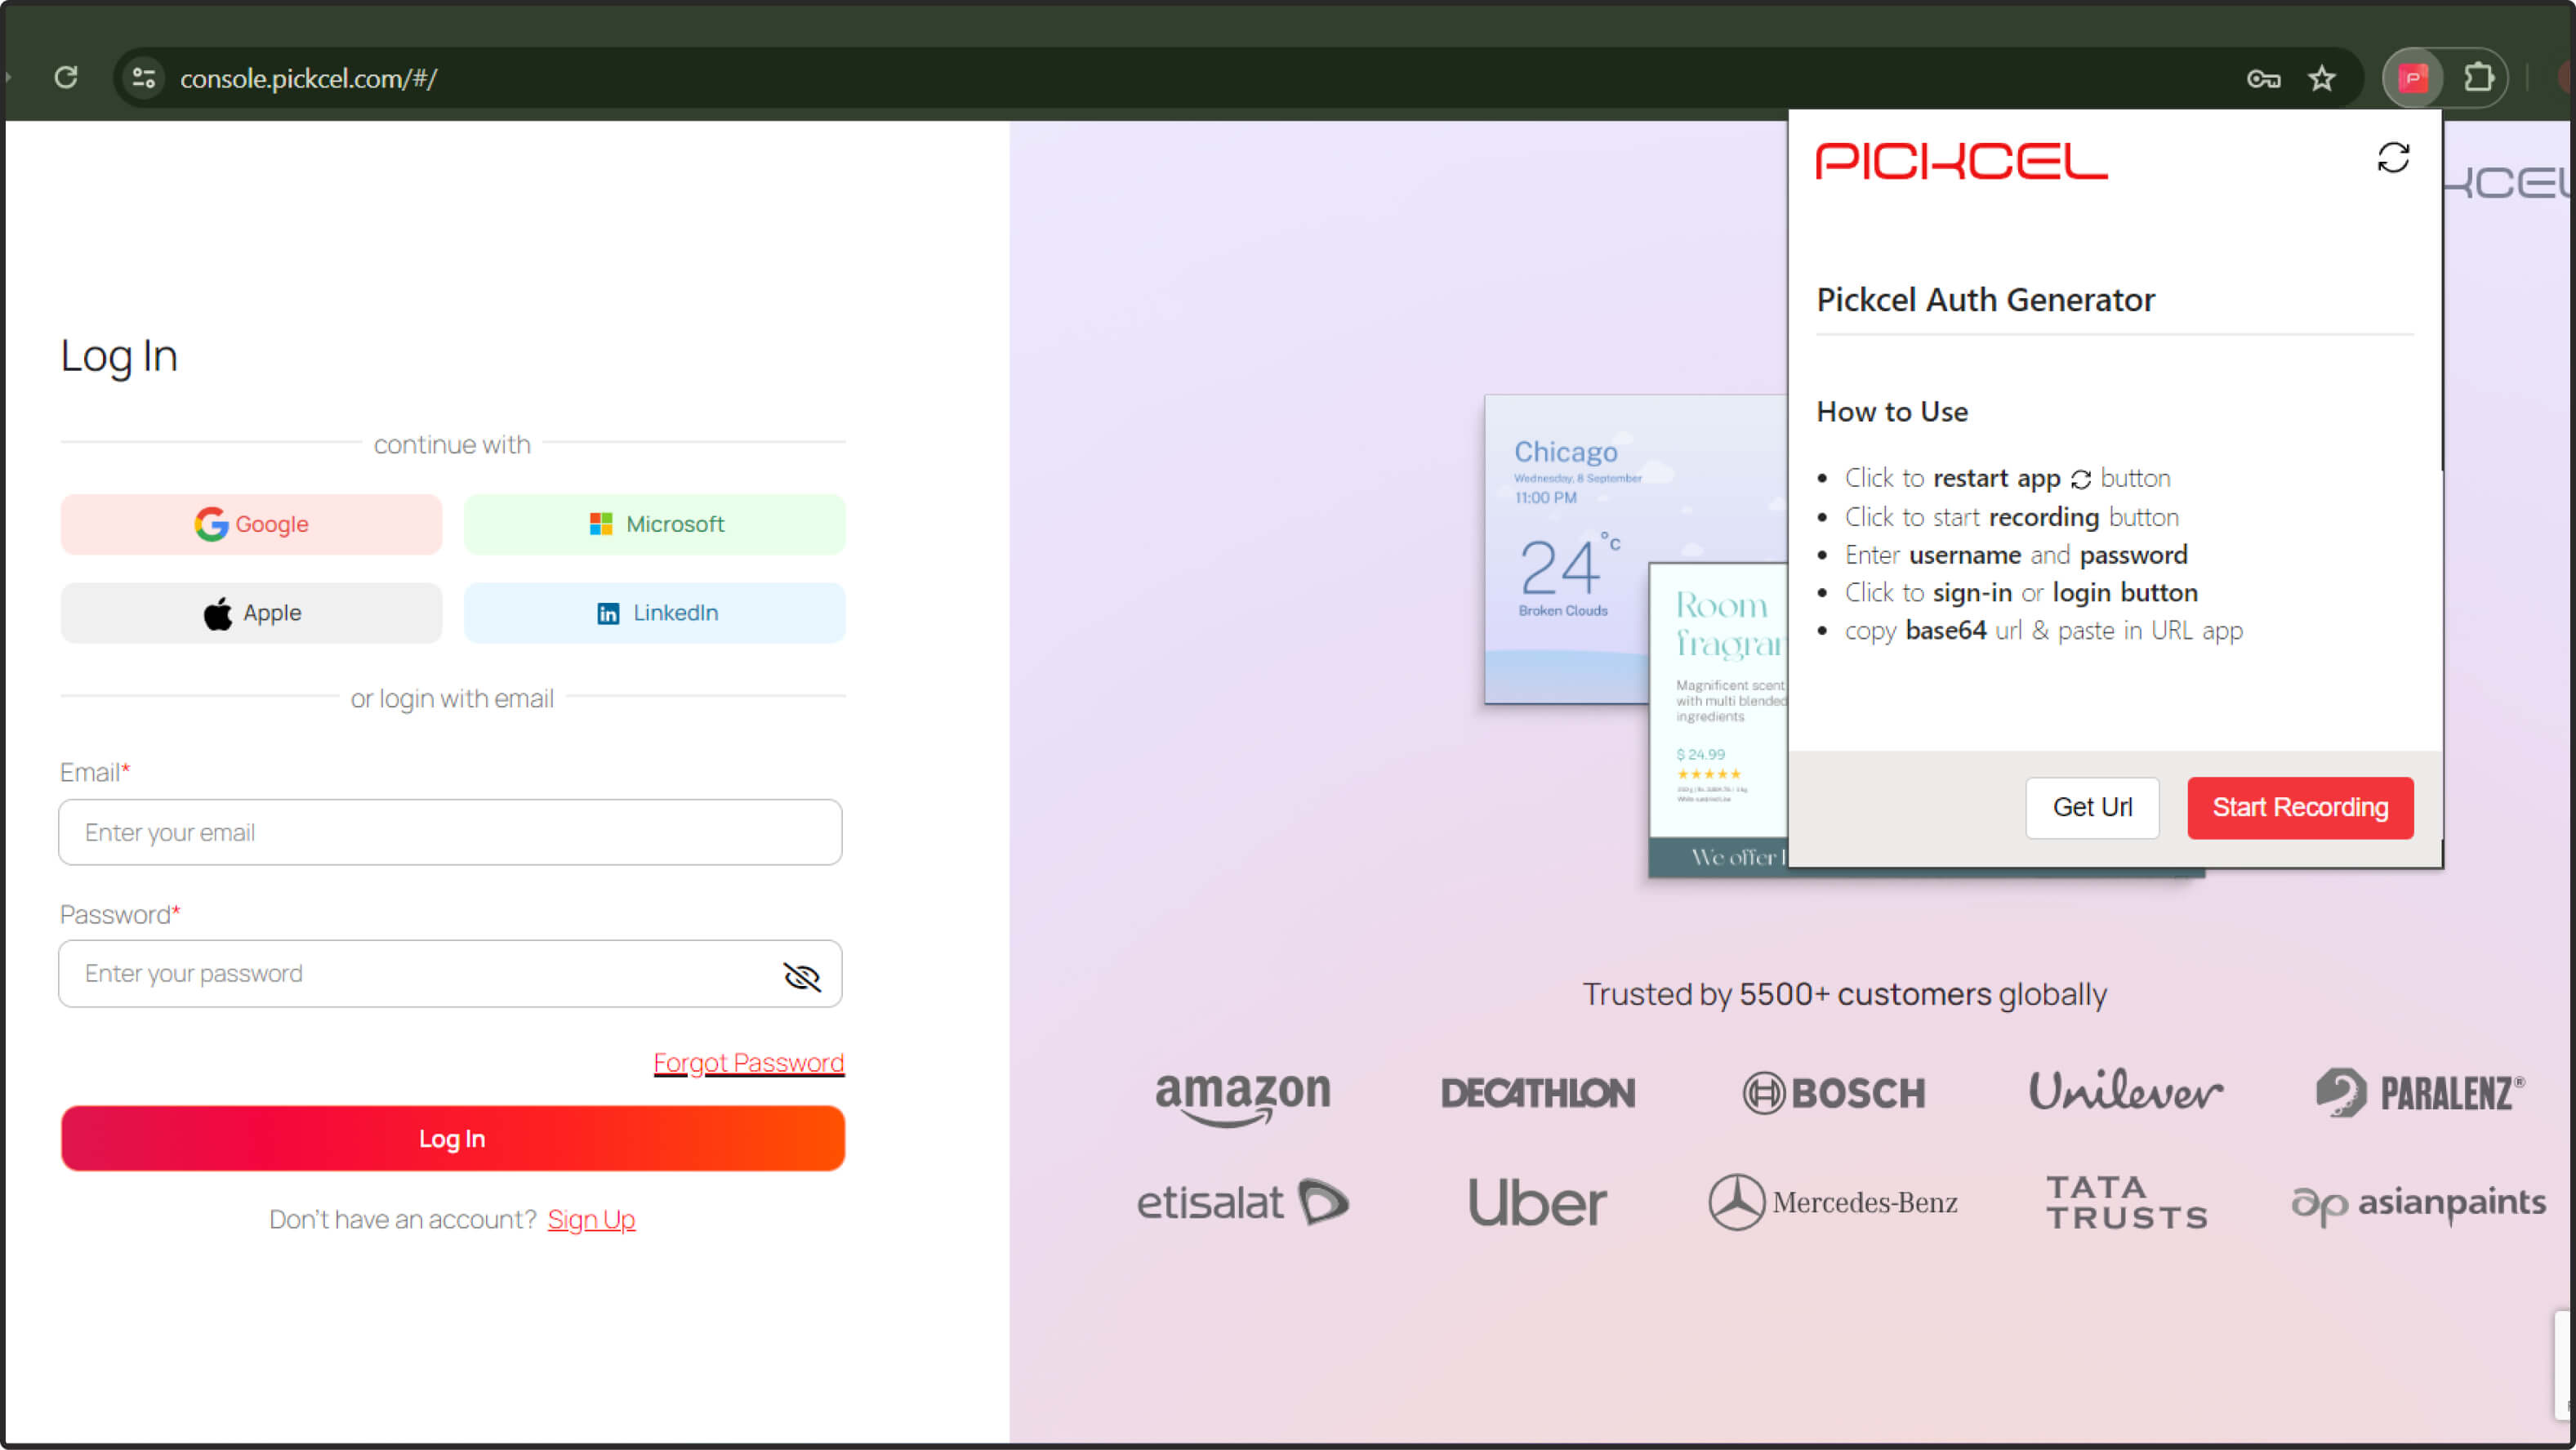
Before configuring the Grafana app, please follow the steps to securely capture the Grafana authentication information. This involves installing a Chrome extension on your browser. This custom app automates the authentication process, ensuring a secure connection for your data. For detailed instructions on installing and configuring the authentication generator app, please contact our support team for a guided onboarding process.
Contact usSeamlessly display grafana dashboards on your digital signage
Step: 1
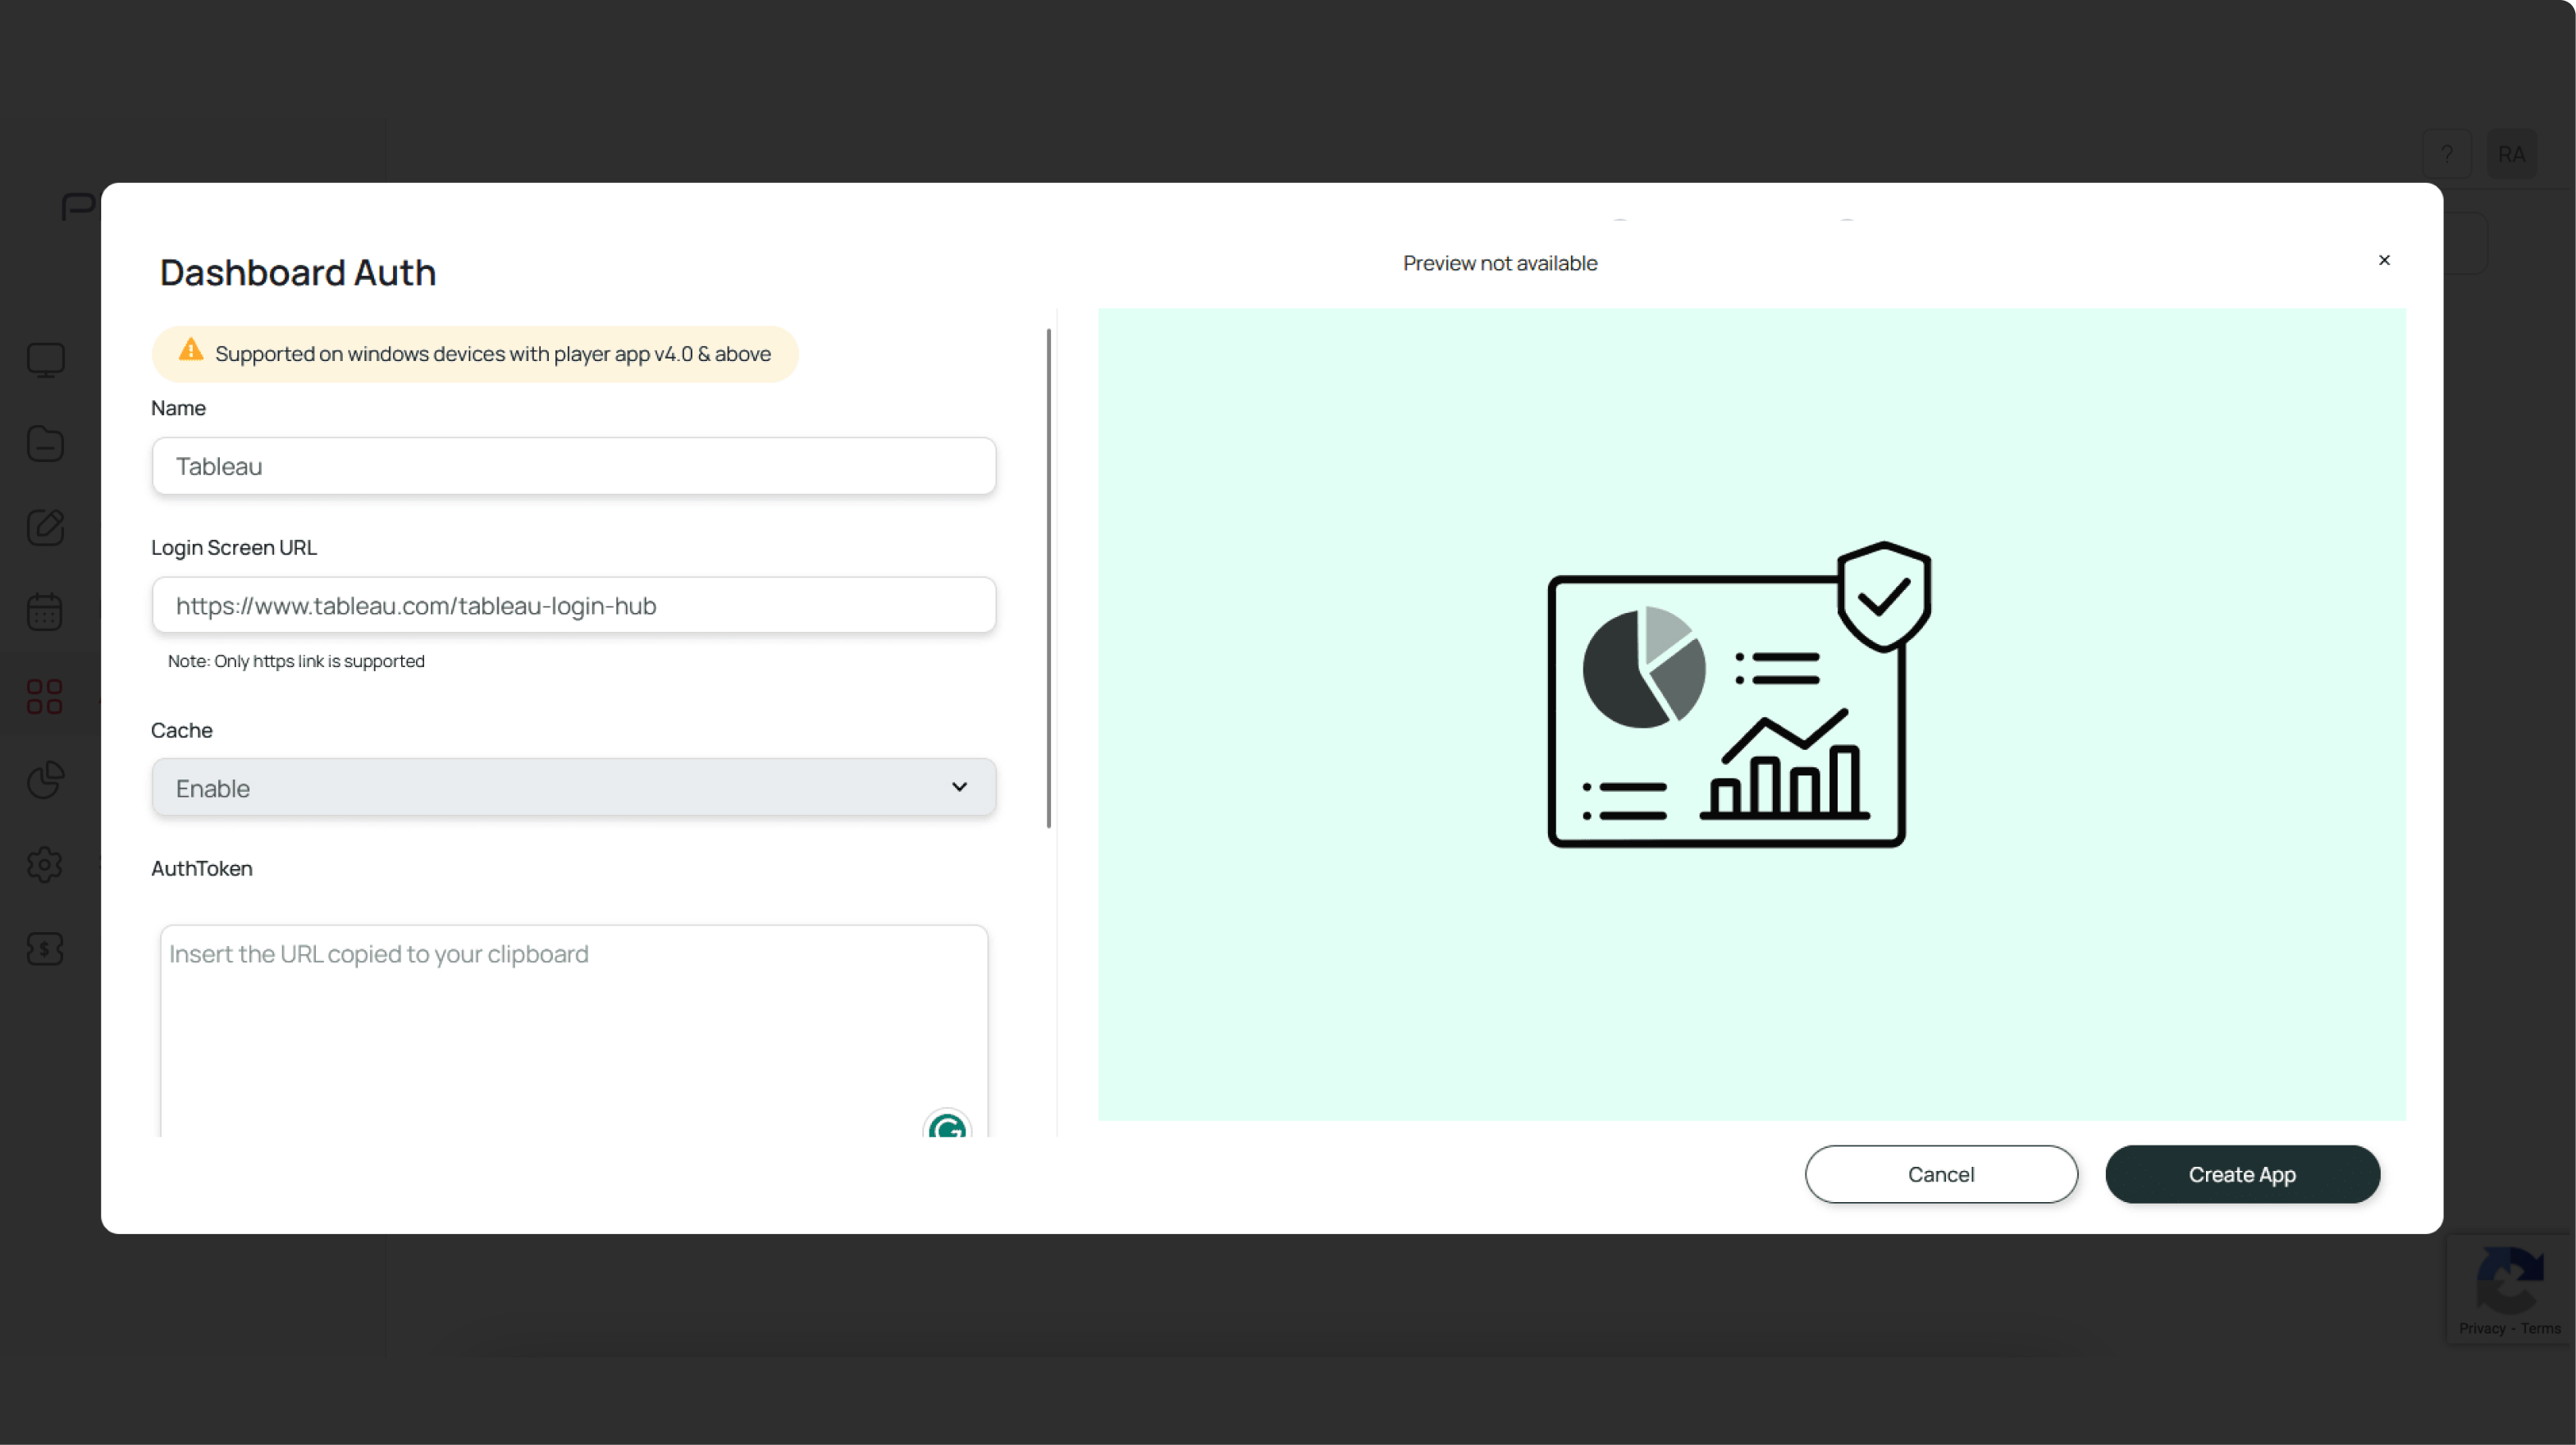
Configure the app from the app store
Search for and click the "Dashboard Auth" app on Pickcel's console. Name the app, copy-paste the login URL of the Grafana Cloud, and configure the remaining parameters. Ensure that you add the Authentication Generator URL onto the clipboard.
Step: 2
Create a composition
Choose to publish full-screen or utilize Pickcel's layouts to combine your Grafana visualizations with other content.
Step: 3
Publish the composition
Select the digital signs you want to display the content on and publish to activate your real-time data visualization experience.


 Schedule Callback
 Schedule Demo
