
Dec 13 2024
5 min read

The way we communicate and share information makes or breaks its impact. While data and information are crucially important in today’s business scenario, how we present that data also matters. If you want to make your workplace more futuristic with the current business stats, metrics, upcoming goals, and milestones coming into life as you walk in, TV dashboards will help you out!
These sleek, dynamic, and visually appealing screens aren’t just for businesses and teams. They can elevate communication in almost all industries.
But what are TV dashboards? What are its use cases across various industries? Most importantly, how can you set up one such TV dashboard? This detailed blog will help you with this.

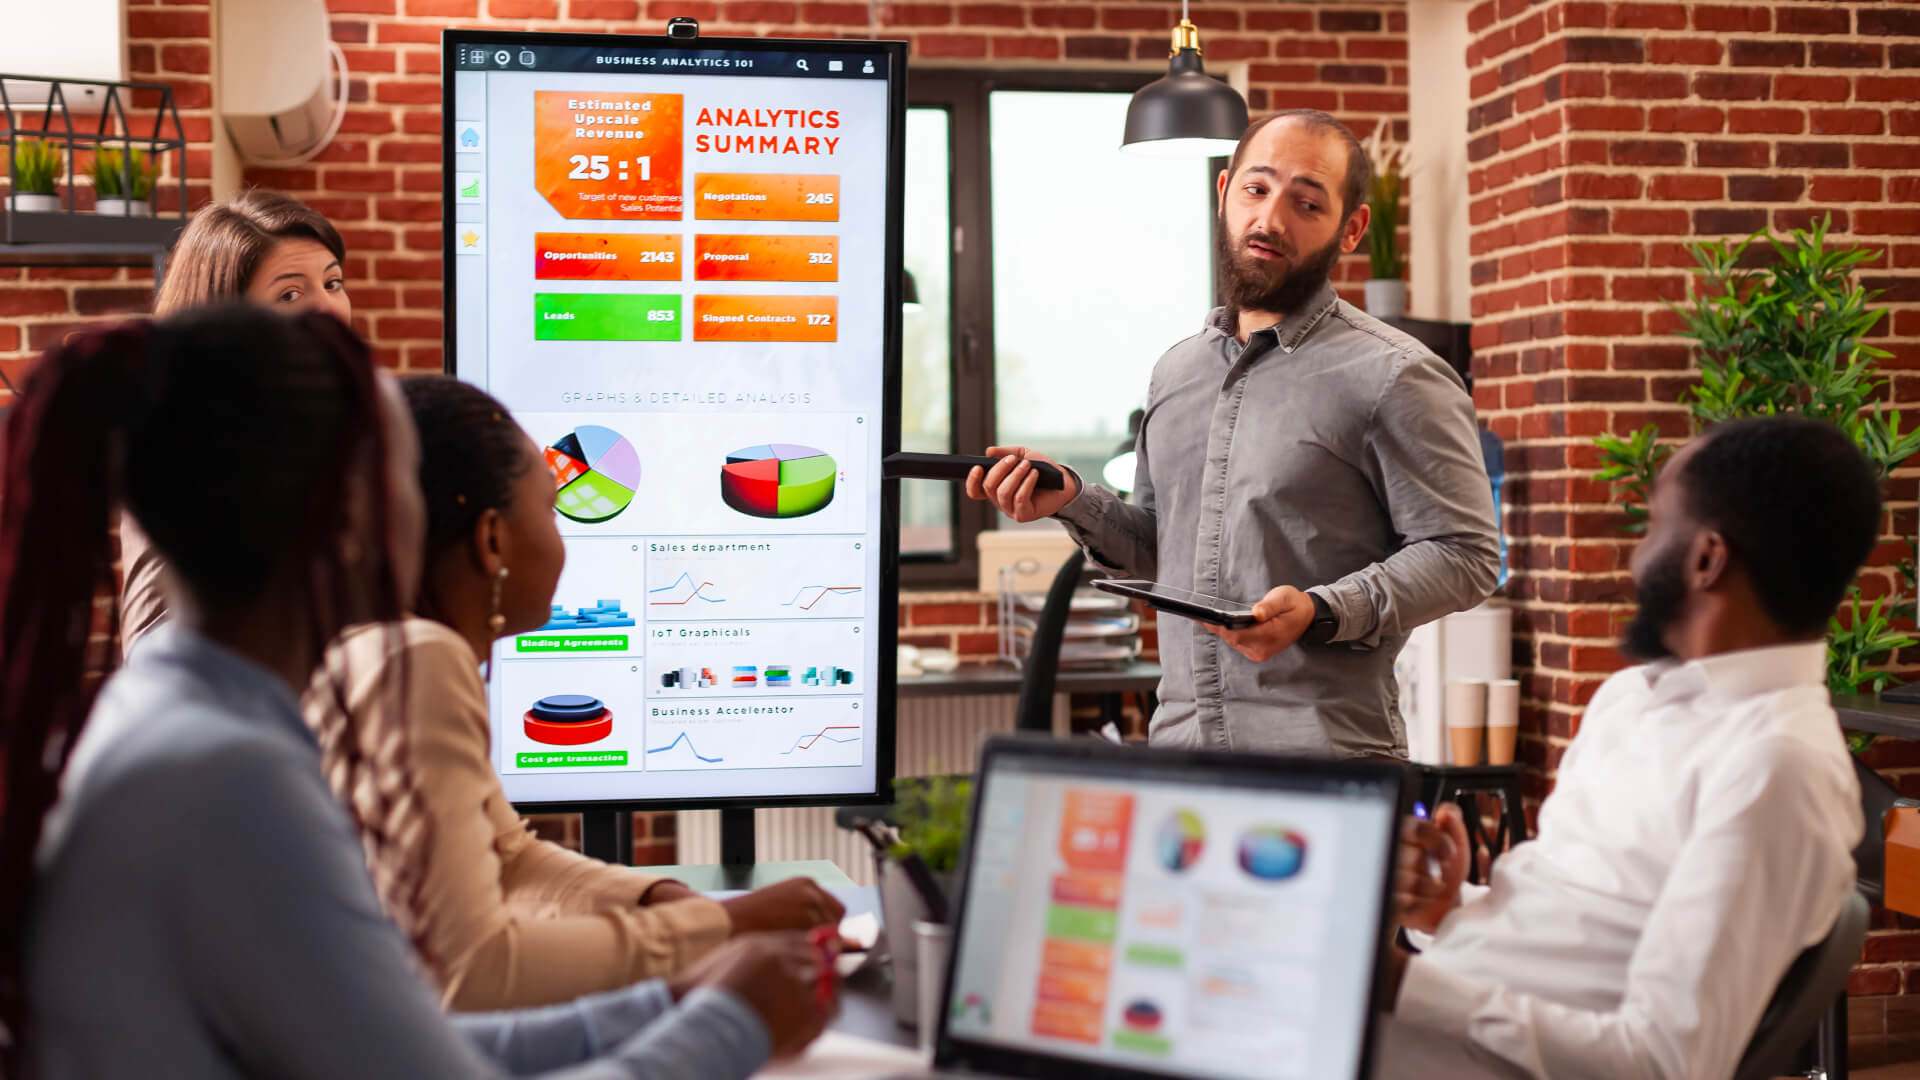
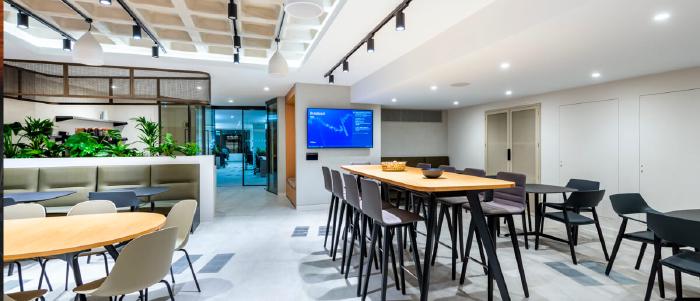
Also known as wallboards, in the simplest terms, TV dashboards are shown on TV screens or wallboards to display crucial key performance indicators (KPIs) and other statistical data. Large-screen displays like TVs pull data and information from various sources and help you visualize them in real-time.
The main difference between traditional and TV dashboards is that the traditional one is limited to personal devices, whereas the TV dashboard promotes team-wide data visibility. By bringing critical statistical data to the forefront, they make it not just more accessible but also actionable.
For example, if you have a sales team, you can use a TV dashboard to showcase and track your team’s daily targets alongside your sales performance. Similarly, in warehouse management, the entire team can use it to monitor their inventory metrics right from a single screen.
Besides better visibility, what more benefits do TV dashboards offer that make them a game-changer for your business? Let’s discuss.
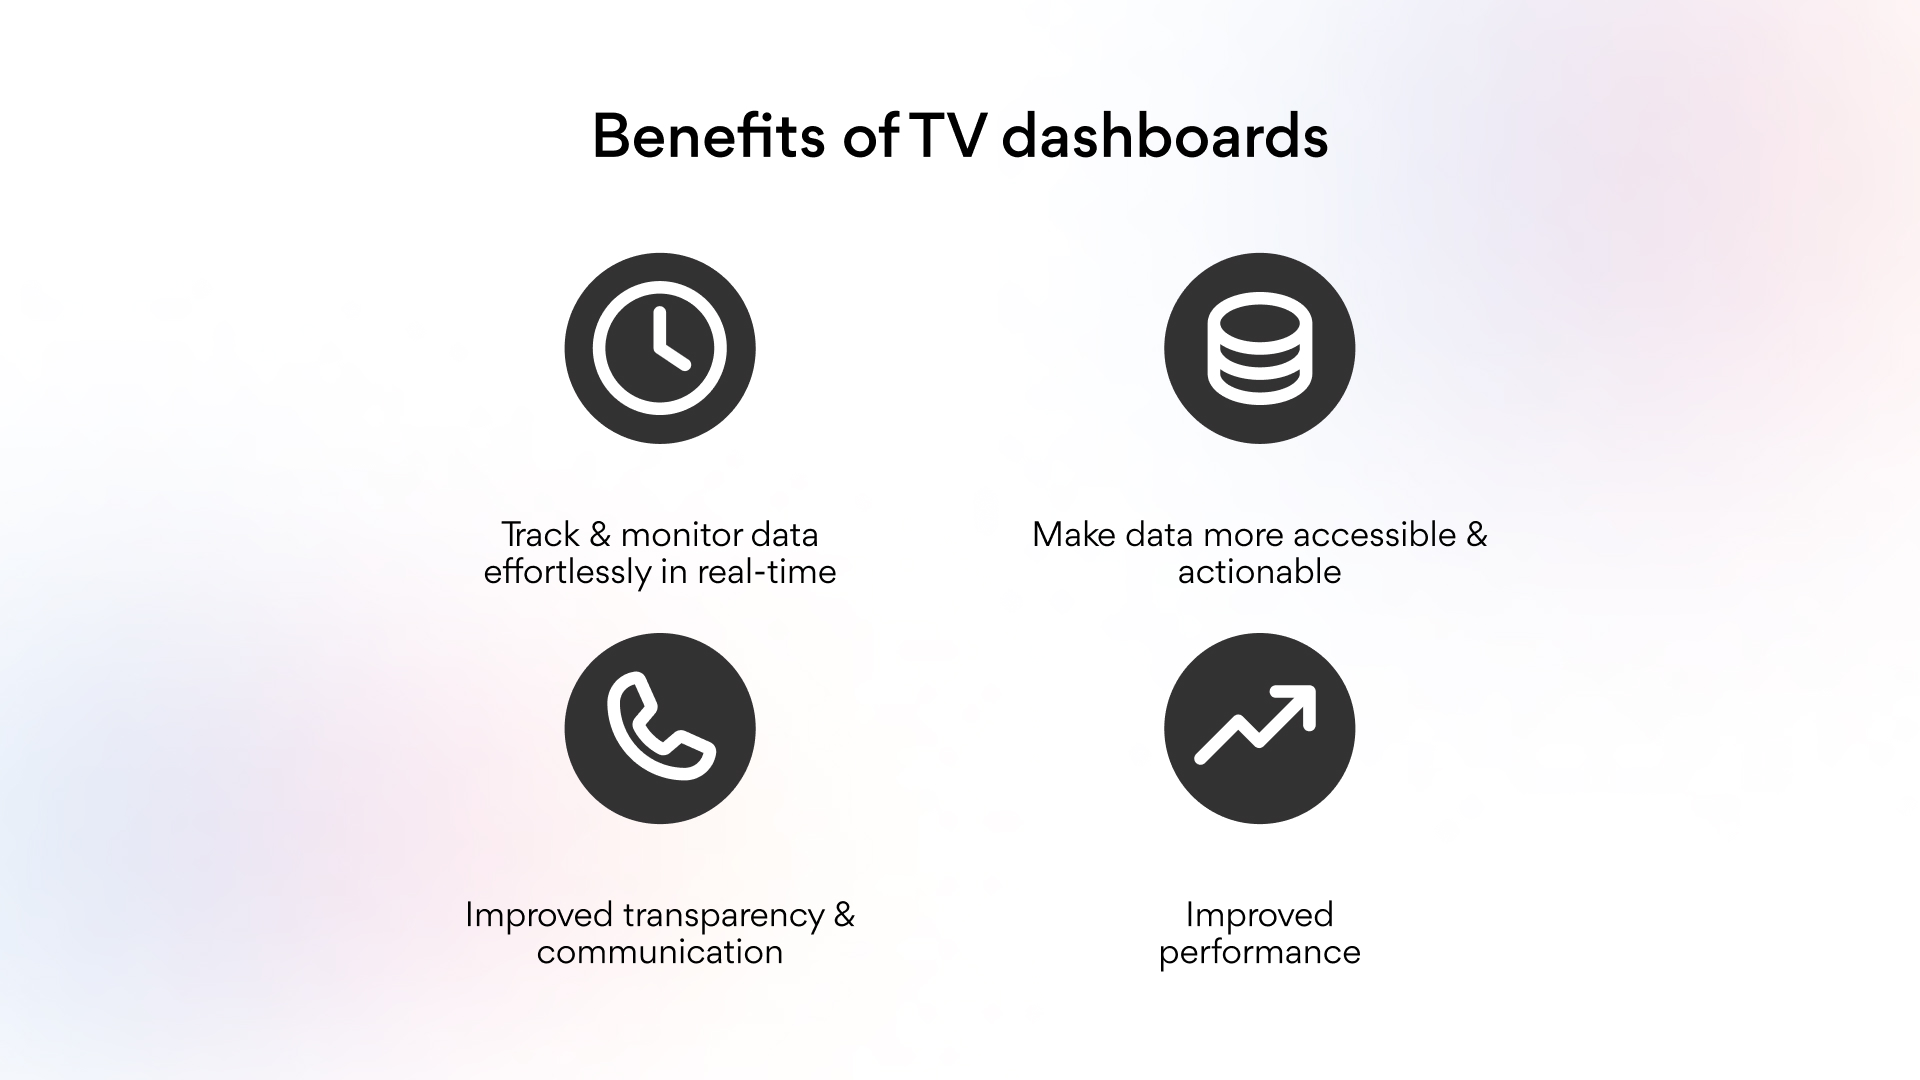
The best part about TV dashboards is that they allow the entire team to view, monitor, and track data and trends and look for possible opportunities in real-time. While the dashboard keeps getting updated with automated data feeds, there’s no need for manual tracking and data entry.
Furthermore, the real-time view of data allows you to notice and respond to sudden changes within minimal time. The entire team doesn’t need to log in to the dashboards on their personal devices to view the stats. Instead, they can monitor it on the dashboard anytime.
Whether it’s project timelines or live sales figures, the crucial data is always in front of your eyes, allowing you to act on them instantly. The team members stay updated and informed of vital stats, which helps them identify trends and seize opportunities at the perfect moment without delay.
Besides improving the accessibility and visibility of data, TV dashboards enhance transparency within the team and the organization as a whole. Every team member is on the same page while tracking data, aligning project deadlines, and tracking and celebrating progress.
This also bridges the communication gap between employees and teammates, thus creating a more cohesive and collaborative workplace.
Visualizing and seeing data and progress stats on large screens motivates employees. The team can see their progress, thus realizing their bottlenecks and overcoming them to reach the set goals.
Furthermore, continuous progress tracking helps them visualize their targets and goals better. This constant visibility of performance metrics keeps everyone focused, accountable, and striving for excellence.
For example, If a sales team uses the TV dashboard to track their daily targets along with their monthly goals, they will be more inclined and driven to meet or exceed them.
You might be wrong if you’ve been thinking these large and versatile screens are just for corporate offices. TV dashboards turn every workplace into a data-driven one across every industry. Let’s explore some of its everyday use cases.
In corporate offices, TV dashboards are used chiefly for tracking team performance and project management. A real-time view of metrics helps the team identify their goals, current lead conversion rates, and fresh seasonal trends. Furthermore, it allows managers to set and showcase project deadlines and task statuses to everyone simultaneously.
Besides sales figures, TV dashboards also help supply chain managers track their inventory and logistics. From current stock levels to upcoming shipments, it presents all the data in a single place, thus optimizing operations.
Furthermore, in retail stores, such dashboards also help to show foot traffic, customer feedback, or loyalty program stats, thus improving the customer experience.
In logistics & supply chain, TV dashboards help monitor equipment downtime, utilization, supplier performance, shipment status, incident reports, etc. The real-time information on such crucial details helps identify and address the workflow disruptions at the earliest.
Do you want a TV dashboard displaying real-time bed availability, patient wait time, and emergency and operation room status? Would it make patient flow and care much easier?
Additionally, such TV dashboards can be used to showcase staff availability and upcoming appointments, ensuring smooth operations while focusing on patient care even during peak hours.
If you’ve been patient till here and want to invest in a TV dashboard, here’s a step-by-step guide to help you out.
A TV dashboard software receives data from the linked database and displays it on TV screens in real time. While choosing a TV dashboard software, you must ensure that the software is easily integrated with your existing data sources.
Furthermore, the software should be non-interactive and presentable as a clean display. Go for solutions offering remote management and indefinite displays to avoid session timeouts.
While selecting your digitsl signage hardware, go for a high-quality TV or monitor with an HDMI input. The display quality should be HD or 4K to ensure clear visibility even from a distance. The size of the screen depends on the space area.
Home screen sharing, such as “Chromecast,” is not feasible for running dashboards in the long run. You can also go for SOC (system-on-chip) displays, as they are commercial-grade displays and are much more powerful.
Also read: How soc players are future of digital signage
In the next part, you must select the KPIs and the data sources you want to show on the TV dashboard. This may be CRM data, social media analytics, operational KPIs, sales figures, or any other data. Ensure that the software supports these integrations to ensure the TV shows accurate and real-time data.
Now, you need to connect your TV to the dashboard software. This can be done via:
A streaming device like a Chromecast, Amazon Fire Stick, or Apple TV
A direct connection using a computer or media box
Cloud-based options that sync directly with smart TVs
The next step is to design your dashboard. Focus on showing the most critical KPIs first that support your business goals. Keep your dashboard clean and well-designed, and add charts, graphs, and other such figures for better visualization.
Focus on representing the data in the form of visuals. Keep the design simple, easy to read, informative, and visually appealing.
Once your dashboard is ready, you can set up automated data refresh so that the information stays accurate and up-to-date in real time. Now, test it in its designated location to ensure readability and functionality. Gather feedback from your team to make improvements and fine-tune the display for maximum impact.
Also read: A guide on how to use tv for digital signage
If you already have a digital signage screen and software, you can also create your TV dashboard easily. The signage screen is the hardware, whereas the digital signage software helps you share real-time insights on the screen.
Some of the benefits of using your digital signage screen for TV dashboards are:
Most digital signage software available today supports seamless integration with dashboard tools such as Google Analytics, Power BI, etc. This seamless and hassle-free integration ensures that the real-time data is displayed in a visually appealing manner.
Digital signage platforms allow you to create dynamic layouts, rotate content, and add brand-specific visuals, making your TV dashboard not only functional but also visually aligned with your organization’s identity.
With digital signage software, you can manage multiple TV dashboards from a single platform, no matter where the screens are located. This is particularly useful for organizations with distributed teams or retail chains.
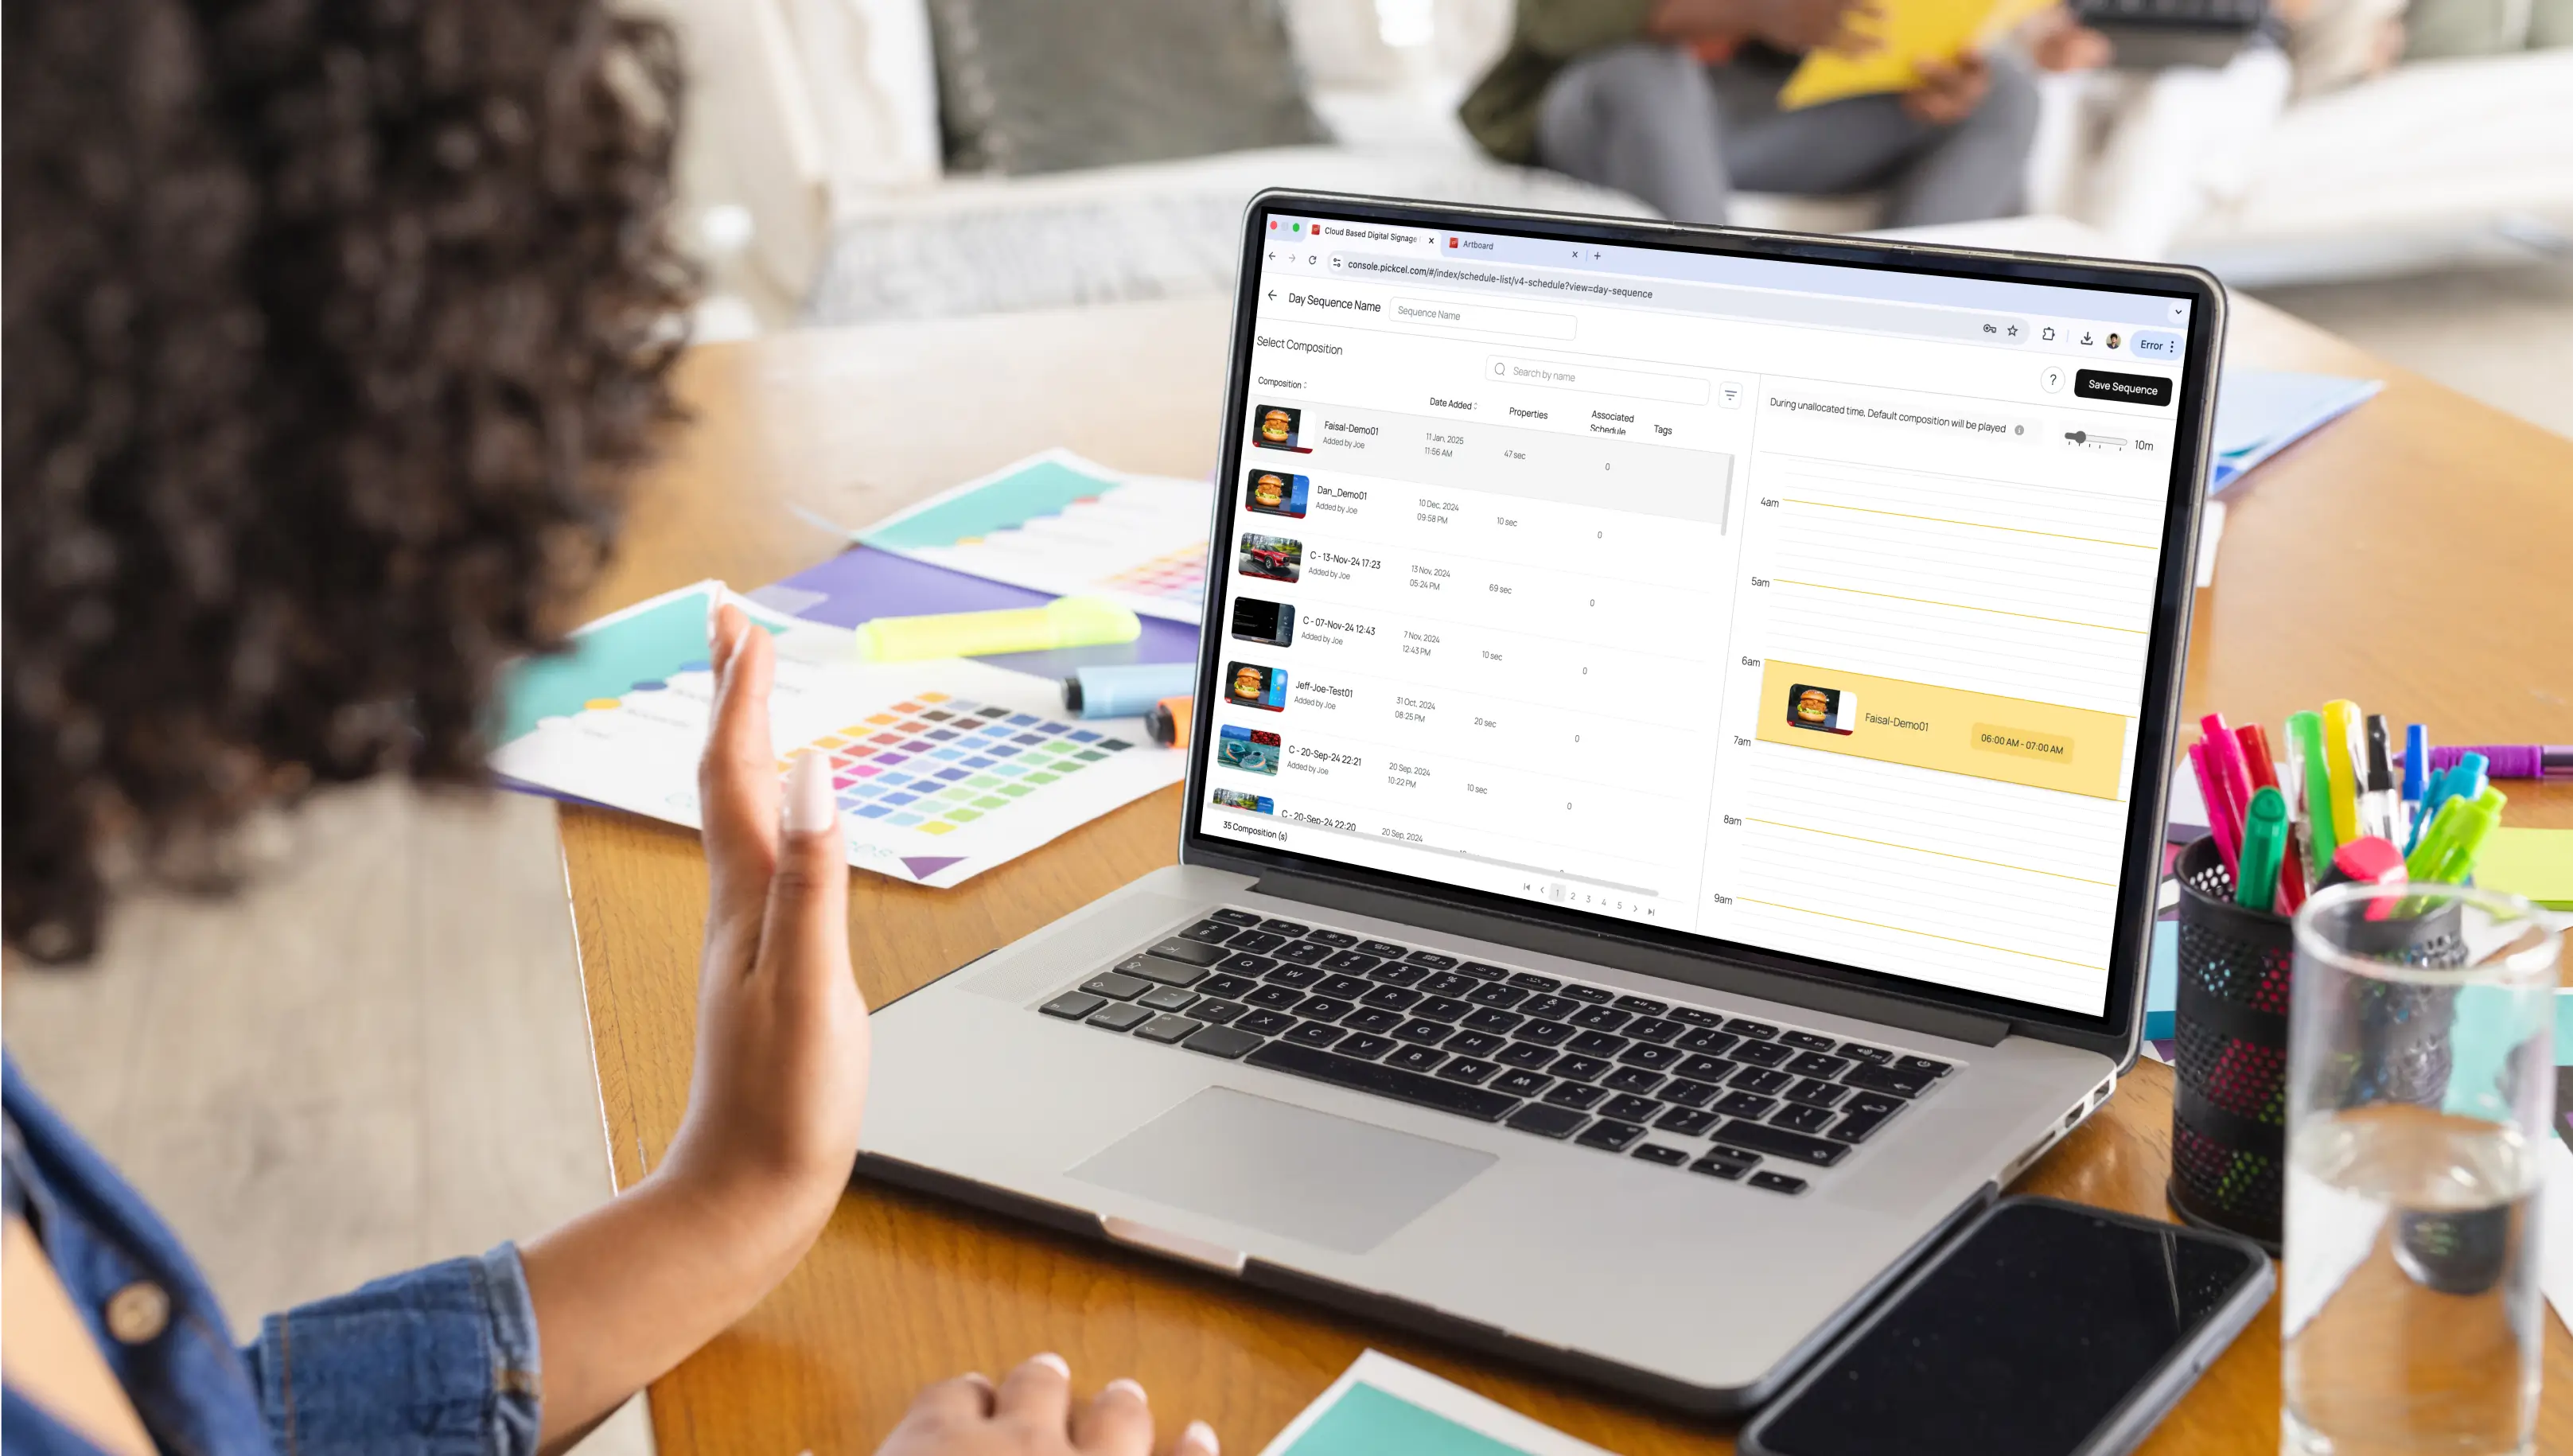
If you’re looking ahead to turn your digital screen into a TV dashboard showing Power BI stats, look no further than Pickcel. It’s a leading digital signage software with robust Power BI integration, which helps you show your live data on screens with just a few clicks. From KPIs to analytics, you can show real-time trends across one or multiple screens.
The best part about Pickcel is its ease of use. Bringing your dashboard data to the big screen takes just a few minutes. Connect your Power BI account, select the desired reports or dashboards, and digital signage display them on your TV through Pickcel’s intuitive interface. Isn’t it simple? Try out Pickcel today!
If you want to make your workspace more data-driven and information-centric, TV dashboards are undoubtedly a game changer. They can turn raw data into actionable insights, thus assisting the team in better and more informed decision-making. If you want to build a workplace for the future, invest in a TV dashboard right now!


Dec 13 2024
5 min read

Nov 12 2024
7 min read
Oct 29 2024
6 min read

Oct 29 2024
6 min read
Take complete control of what you show on your digital signage & how you show it.
Start Free Trial Schedule My Demo