
Dec 13 2024
5 min read

Modern Business Intelligence (BI) uses processes and tools to analyze data, helping businesses make informed decisions. Traditionally, BI was complex and tailored to individual decision-makers, but modern BI tools have evolved into user-friendly systems that make it easy to understand large volumes of data quickly.
Power BI and Tableau are leading Business Intelligence (BI) technologies that excel in collecting, integrating, analyzing, and presenting business data. They stand out for their ability to provide the right data at the right time through intuitive interfaces, simplify complex analysis, and enable insightful decision-making. This blog offers a quick overview of these popular BI tools, highlighting their key uses and features.
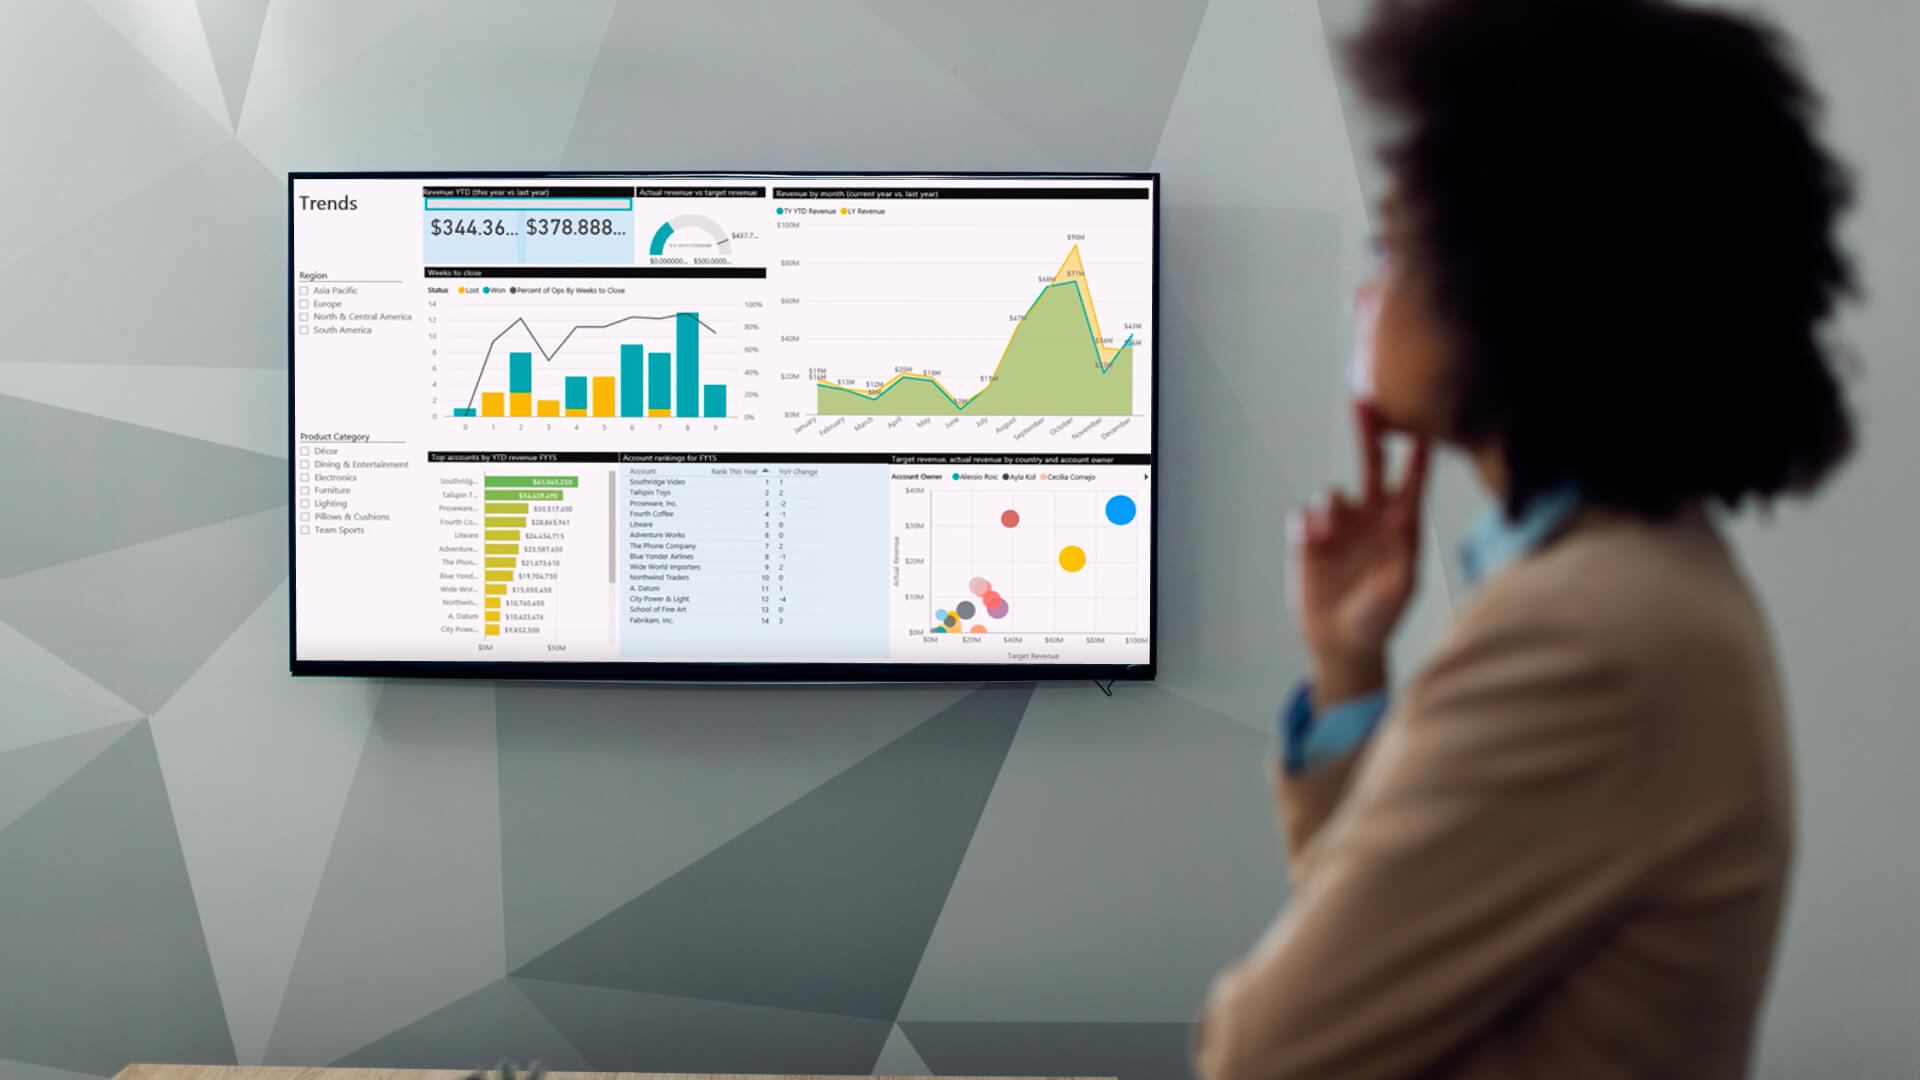
Power BI is a business analytics service developed by Microsoft that offers interactive visualizations and business intelligence capabilities with a user-friendly interface. It integrates seamlessly with the Microsoft ecosystem, working smoothly with tools like Excel, PowerPoint, and SharePoint, making it accessible for users familiar with these applications. Power BI allows users to connect to multiple data sources, clean and transform data, create custom calculations, and visualize information through charts, graphs, and tables.
Power BI is highly versatile, accessible via desktop, web browser, and mobile devices, making it easy for users to interact with their data anywhere. The platform includes a robust desktop application, a powerful backend with Power Query for data access, and a user-friendly front end for data visualization. It also features the Power BI service, which facilitates sharing and collaboration on dashboards, allowing organizations to make data-driven decisions and gain insights into their business performance with automatic data refresh capabilities.
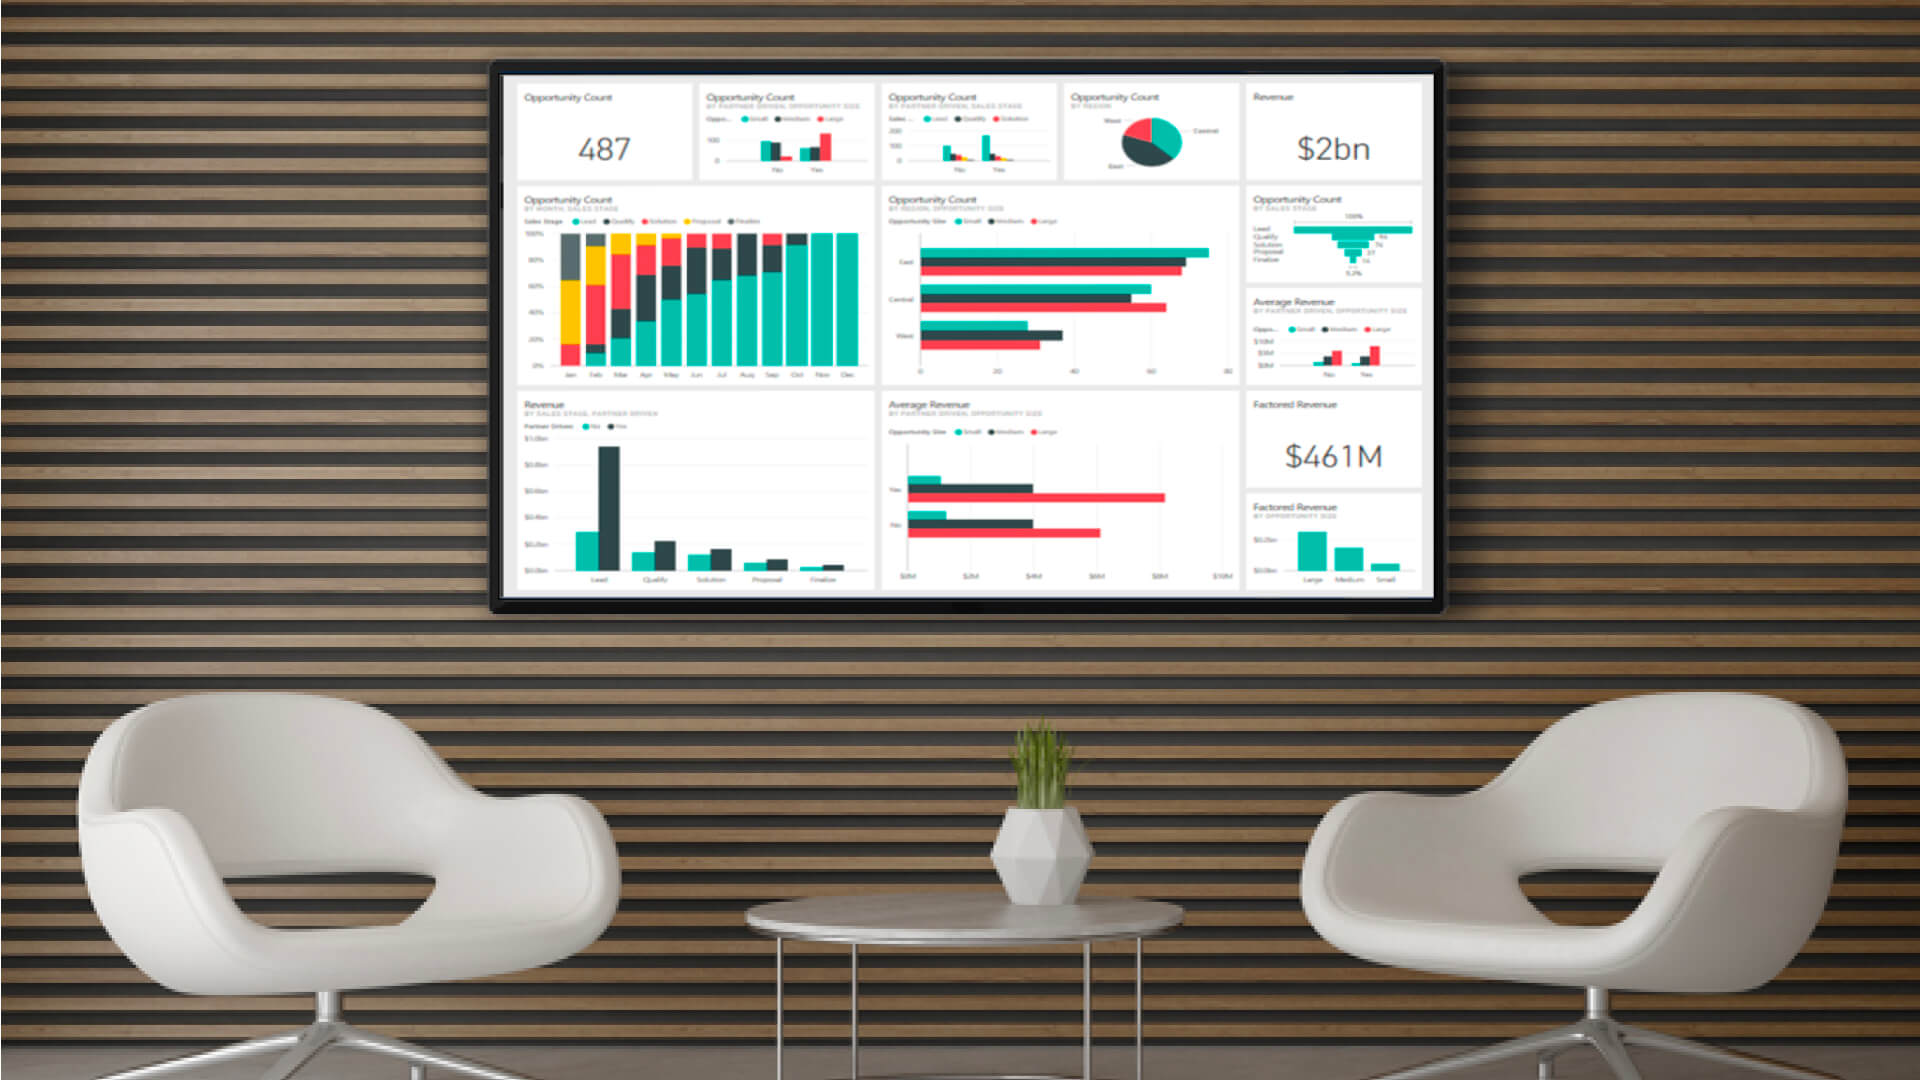
Tableau is a leading data visualization and business intelligence tool that allows users to connect, visualize, and share data interactively and intuitively. Acquired by Salesforce in 2019, Tableau is known for its drag-and-drop interface, enabling users to analyze and explore large and complex datasets without the need for coding skills. It offers a wide range of visualization options, including line charts, bar charts, maps, and scatter plots, making data analysis accessible and engaging for everyone.
Tableau’s suite of products includes Tableau Desktop for creating and publishing visualizations, Tableau Server for sharing and collaborating on data across an organization, and Tableau Prep Builder for preparing and cleaning data before analysis. It connects seamlessly to various data sources, such as databases, spreadsheets, and cloud services. Additionally, Tableau offers Tableau Online for cloud-based project hosting and Tableau Public, a free platform for creating and sharing visualizations with the broader community, enhancing collaboration and knowledge sharing.
| Feature/Aspect | Power BI | Tableau |
|---|---|---|
| Setup | Available as Power BI Desktop, Power BI Mobile, and Power BI Service. | Includes Tableau Prep, Tableau Desktop, Tableau Online, and Tableau Server. |
| Data Visualization | Focuses on data manipulation first, with visualization as a secondary step. Provides various visualizations and drill-down features. | Excels in large data sets with interactive, on-the-fly visuals and strong drill-down capabilities. |
| Compatibility | Only works on Windows OS. | Works on both Mac and Windows. |
| Cost | Offers a free version and cost-effective Pro licenses. | Generally higher cost, especially for enterprise-level deployments. |
| Community & Support | Strong community and Microsoft support with extensive resources. | Large, active user community with extensive online resources and professional support. |
Here are some of the top features loved by Power BI users:
Data Transformation: Provides robust tools for cleaning, shaping, and transforming data before analysis.
Interactive Dashboards: Creates interactive and customizable dashboards that consolidate various visualizations.
Natural Language Queries: Allows users to ask questions in natural language to generate insights and visualizations.
Data Connectivity: Connects to a wide range of data sources, including cloud services, databases, and spreadsheets.
Power Query: A powerful tool for data extraction, transformation, and loading (ETL) processes.
Advanced Analytics: Supports advanced analytics with built-in AI capabilities and integration with Azure Machine Learning.
Real-Time Data Updates: Provides real-time data updates and live connections to ensure up-to-date insights and analysis.
Here are some of the noteworthy features in Tableau:
Data Prep: Provides tools to clean, shape, and combine data before analysis.
Dashboards: Integrates multiple visualizations and interactive elements into a cohesive view.
Forecasting: Uses historical data to predict future trends and outcomes.
Interactive Filters: Allows users to dynamically filter data in dashboards to explore different perspectives.
Data Blending: Combines data from multiple sources into a single view for comprehensive insights.
Geocoding: Maps data geographically to analyze spatial patterns and trends.
Storytelling: Uses data stories to guide viewers through insights with a narrative approach.
Integrating Power BI with Pickcel allows you to showcase your dashboards on digital signage screens easily, presenting real-time data and analytics directly to your audience. Simply log in to the Pickcel console, find the Power BI app, and connect using your Microsoft credentials.
This connection enables you to display your reports and insights effortlessly, turning data into impactful visual content that keeps your audience informed and engaged. For a seamless setup and to start sharing your data insights, check out our detailed guide: How to use the Power Bi app in Pickcel.

Integrating Tableau with Pickcel is fairly straightforward and allows you to display your dashboards on digital signage screens securely. All you need is the Dashboard App extension, which allows you to log in safely, and then you can log in using the Dashboard Auth in Pickcel console to showcase your Tableau visualizations.
This integration is perfect for sharing real-time business insights, performance metrics, and other key data points directly with your audience. For a detailed setup guide, check out: How to use the Dashboard App. To learn more about integrating Tableau on your digital signage platforms,
Using Pickcel to display dashboard data offers a range of benefits that improves both functionality and impact. Whether you’re showcasing Power BI or Tableau dashboards, Pickcel offers a secure and versatile platform for showcasing real-time data visualizations on digital signage screens. This setup is ideal for various scenarios, such as tracking team performance, showing estimated wait times, or sharing company-wide metrics.
With Pickcel, you can integrate these dashboards seamlessly, ensuring that your data is not only accessible but also engaging. Additionally, Pickcel’s unique zone feature allows you to combine your dashboards with other content, creating a dynamic and informative visual experience that maximizes the value of your BI data.
Get in touch with us to know more: Schedule a demo.



Dec 13 2024
5 min read

Dec 13 2024
8 min read

Dec 4 2024
7 min read

Nov 27 2024
5 min read
Take complete control of what you show on your digital signage & how you show it.
Start Free Trial Schedule My Demo